
Launch is not the finish line. Launch is day zero of the saas product-market fit hunt, and most founders treat day zero as a celebration when it should be a recalibration. The 90 days after launch decide whether the saas reaches product-market fit, pivots to a different value proposition, or kills the idea before more capital is consumed.
This guide gives the 90-day playbook for moving from MVP launch to saas product-market fit. It covers what PMF actually looks like in numbers (not platitudes), the five definitions of PMF from the most-cited frameworks (Andreessen, Ellis, Rabois, Balfour, Rachitsky) and where they agree, the 7 signals that genuinely indicate PMF versus the 7 vanity metrics that mislead, the 90-Day PMF Ledger template that tracks signals weekly, the day-by-day execution across three 30-day phases, retention cohort reading (the only chart that matters), the Sean Ellis test with caveats, and the Pivot/Persevere/Kill decision at day 90.
Five takeaways before reading on: PMF is measured in retention curves and word-of-mouth velocity, not in revenue or signups; the 7 signals that matter are different from the 7 most-tracked metrics; the 90-Day PMF Ledger turns the hunt into a structured weekly review; the day-90 decision is a real fork, not a vanity check-in; and after PMF, the same metrics break and need to be replaced with growth-stage signals. For the broader build framework that places this stage in context, see how to build a saas in 2026.
What Saas Product-Market Fit Actually Looks Like in Numbers
Saas product-market fit is the point at which the product retains users at a rate that compounds, generates word-of-mouth that reduces CAC, and converts trial users at a rate that supports the unit economics. The numbers vary by motion (B2B sales-led, B2B PLG, consumer prosumer), but the patterns converge on a tight band.
Retention. Net dollar retention above 100 percent for B2B sales-led, monthly logo retention above 95 percent. Flat retention curves (cohorts that retain a stable percentage of users month over month after the initial drop) are the strongest single indicator.
Word-of-mouth. Roughly 30 to 50 percent of new signups attribute the product to a referral, search for the brand directly, or come from a social mention. CAC drops as a percentage of LTV; the ratio improves without ad spend increasing.
Activation. 50 to 70 percent of signups reach the first meaningful action within 24 hours of signup. Below 40 percent, the onboarding is broken; above 70 percent, the activation event is set too low.
Time-to-value. First meaningful value delivered within 5 to 15 minutes of signup for self-serve, within 1 to 3 days for sales-led. Long time-to-value is the single most common reason saas products fail to find PMF.
Payback period. CAC recovered within 12 to 18 months for B2B saas, faster for prosumer. Payback periods longer than 24 months are a structural unit-economics problem that PMF cannot fix.
Net Revenue Retention (NRR). 100 to 130 percent for healthy B2B saas, 130 to 150 percent for top-quartile vertical saas. NRR below 90 percent signals churn problems that PMF will not survive.
Sales-cycle compression. B2B sales-led saas at PMF show a 20 to 40 percent reduction in sales-cycle length over the first 90 days post-launch as positioning sharpens. Sales cycles that stay flat or grow signal positioning problems.
The numbers are guideposts, not gates. A B2C consumer saas will have different retention math than a B2B sales-led product. The patterns matter more than the specific thresholds. The canonical reference for these benchmarks is a16z’s 16 Startup Metrics, which covers the saas product-market fit indicator set in industry detail.
Five Definitions of Saas Product-Market Fit
Five well-documented PMF frameworks dominate saas product-market fit conversations. They use different language but agree on the underlying signal.
Marc Andreessen (2007). “You can always feel product-market fit when it is happening. The customers are buying the product just as fast as you can make it, or usage is growing just as fast as you can add more servers. Money from customers is piling up in your company checking account.” Frame: PMF is a felt economic pressure; the saas cannot keep up with demand.
Sean Ellis (2010, 40 percent rule). Survey current users with the question “How would you feel if you could no longer use this product?” If 40 percent or more answer “very disappointed,” the saas has product-market fit. Frame: PMF is measured by user emotional dependence, not revenue.
Keith Rabois (Square, OpenDoor framework). PMF exists when users will go to extreme lengths to use the product despite friction. The signal is willingness to tolerate bugs, slow features, and rough edges. Frame: PMF is measured by tolerance for product imperfection.
Brian Balfour (Reforge, HubSpot). PMF is the alignment of four fits: market fit, product fit, channel fit, and model fit. Saas products at PMF show consistency across all four; failures show one or more misalignments. Frame: PMF is a multi-dimensional alignment, not a single metric.
Lenny Rachitsky (PMF survey methodology). Adds qualitative depth to the Sean Ellis test by surveying users on what specifically would disappoint them, what they would use as a substitute, and what kind of users they recommend the product to. Frame: PMF is measured by understanding the user’s mental model of the product.
The five frameworks agree on three points despite their different vocabularies. First, saas product-market fit is observable, not theoretical; founders who cannot tell whether they have PMF do not have it. Second, retention and demand pull are the underlying signals; the various frameworks are different ways of measuring the same underlying phenomenon. Third, PMF is a threshold, not a continuum; saas products either have it or do not, with rare ambiguous cases.
The pragmatic synthesis: track Sean Ellis-style surveys, retention cohorts, word-of-mouth attribution, and demand pull (signups outpacing capacity). When 3 of 4 agree, the saas has PMF. When 1 or fewer agree, it does not. When 2 agree, the answer is “iterate, do not pivot, do not declare PMF.”
The 7 Saas Product-Market Fit Signals
Most saas teams track the wrong metrics during the saas product-market fit hunt. Vanity metrics feel productive but do not predict PMF; the seven signals that matter are less flattering but more predictive.
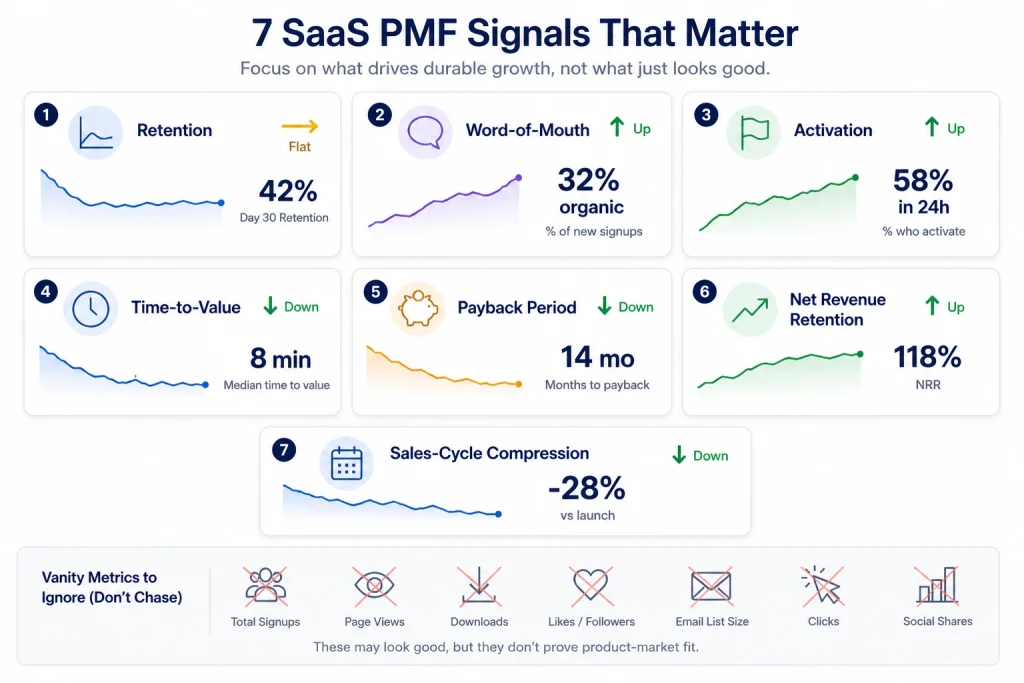
The 7 saas product-market fit signals that matter:
- Retention curve flatness. Cohorts that retain a stable percentage after the initial drop indicate PMF. Declining curves indicate no PMF, regardless of growth.
- Word-of-mouth attribution. Percentage of new signups from referrals, brand search, or organic discovery. PMF saas reaches 30 to 50 percent organic share within 60 to 90 days.
- Activation rate. Percentage of signups completing the first meaningful action. 50 to 70 percent at PMF.
- Time-to-value. Minutes from signup to first meaningful value delivered. PMF saas hits 5 to 15 minutes for self-serve, 1 to 3 days for sales-led.
- CAC payback period. Months to recover customer acquisition cost. 12 to 18 months at PMF for B2B sales-led.
- Net revenue retention. Year-over-year revenue from existing customers, including expansion. 100 to 130 percent at PMF.
- Sales-cycle compression. Reduction in sales-cycle length over time as positioning sharpens. 20 to 40 percent compression in the first 90 days at PMF.
The 7 vanity metrics that do not predict saas product-market fit:
- Total signups (without retention attached, signups are demand for free, not paid).
- Total revenue (without retention and unit economics, revenue is one-time pull, not PMF).
- Press mentions (PR is a signal of marketing skill, not product-market fit).
- Investor enthusiasm (investors react to founder pitch quality, not PMF data).
- Social media followers (followers are vanity unless they convert).
- Feature ship velocity (shipping fast without measurement is feature factory).
- Total addressable market (TAM) calculations (TAM is a hypothesis, not a PMF signal).
The pattern across the 7 vanity metrics: they correlate with founder activity, not with customer behavior. The 7 signals correlate with customer behavior, which is the only thing that predicts PMF.
The 90-Day Saas Product-Market Fit Ledger Framework
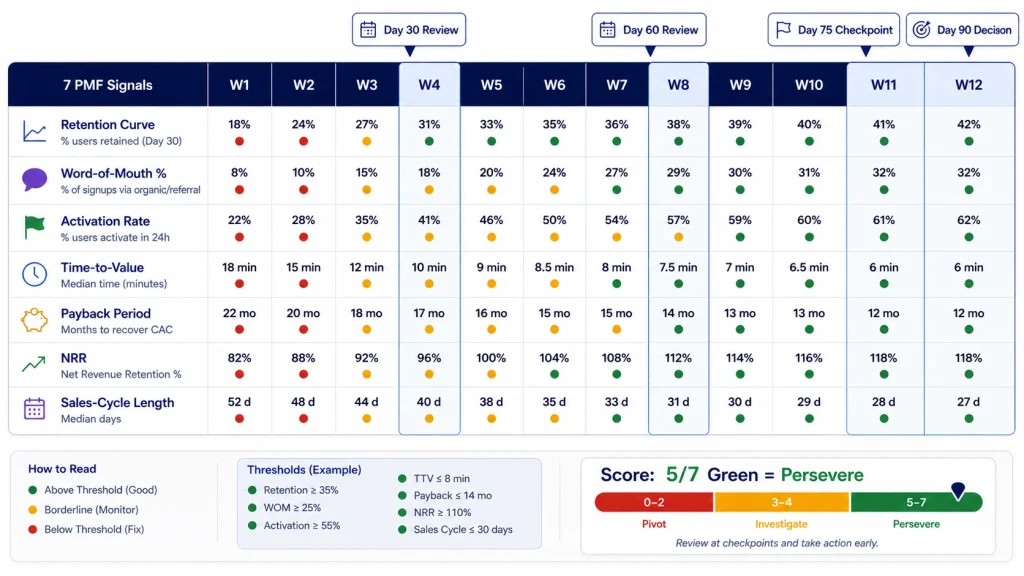
The 90-Day PMF Ledger is the framework that turns the saas product-market fit hunt from a vibe check into a structured weekly review. Twelve weeks of data, seven signals tracked weekly, four reviews at days 30, 60, 75, and 90.
The Ledger structure:
Rows. Seven rows for the seven saas product-market fit signals (retention, word-of-mouth, activation, time-to-value, payback, NRR, sales-cycle compression).
Columns. Twelve columns for 12 weeks of post-launch data, with thresholds for each signal’s “green” (PMF-indicating), “amber” (borderline), and “red” (no PMF) ranges defined per row.
Review checkpoints. Day 30 (instrumentation review, confirm metrics are tracked correctly), Day 60 (activation and time-to-value review, confirm onboarding works), Day 75 (retention check on the first 30-day cohort, the earliest reliable retention signal), Day 90 (full PMF decision, score across all 7 signals).
Scoring. At day 90, count green signals. 5 to 7 green = persevere with confidence. 3 to 4 green = iterate, do not declare PMF, run another 30-day cycle on the weakest signal. 0 to 2 green = pivot or kill.
The Ledger discipline forces founders to confront uncomfortable data weekly. Vibe-based PMF assessments tend toward optimism; data-based assessments tend toward truth. The downloadable Ledger template is included at the end of this article. The full pre-launch operational checklist that produces the data needed to populate the Ledger lives at the saas pre-launch checklist.
Days 1-30 of the Saas Product-Market Fit Hunt: Instrumentation and First Cohort
The first 30 days of the saas product-market fit hunt are about ensuring the data is trustworthy. Founders who skip the instrumentation phase end up at day 60 with bad data and no way to make the day-90 decision.
Days 1 to 7: Instrumentation audit. Confirm every funnel event fires correctly: signup, email verification, first meaningful action, second-day return, week-1 retention, billing event. Audit cookie consent, attribution storage, and per-tenant tagging. Bugs in instrumentation produce wrong PMF conclusions and cost weeks of misallocated effort.
Days 8 to 14: First-cohort obsession. The cohort of users who signed up in week 1 is the most informative cohort the saas will ever have. Watch their behavior obsessively. Who completed activation? Who returned on day 2? Who completed the second meaningful action? Patterns in the first cohort predict the patterns of the next 10 cohorts.
Days 15 to 21: Customer conversation cadence. Schedule 5 to 10 conversations with paying or trialing customers. Ask Mom Test-style questions about their last use of the product, the workflow they replaced, and what was missing. Qualitative data complements the quantitative data; both are needed for PMF assessment.
Days 22 to 30: First Ledger review. Populate the Ledger with the data from weeks 1 to 4. Identify which signals are tracking correctly and which need instrumentation fixes. The day-30 review is not a PMF decision; it is a data-quality decision. Most teams discover at day 30 that 2 to 3 signals were tracking incorrectly, and they rebuild the instrumentation before continuing.
The trap of days 1 to 30: declaring PMF based on early signups and demo enthusiasm. Both are noise. The data needed to assess PMF does not exist until the first cohort is at least 30 days old, which means the earliest reliable PMF signal arrives at day 60, not day 30.
Days 31-60 of the Saas Product-Market Fit Hunt: Activation, Time-to-Value, and the Aha Moment
Days 31 to 60 of the saas product-market fit hunt focus on the early-stage signals: activation rate, time-to-value, and the aha moment that converts trial users to paying customers.
Days 31 to 40: Activation rate optimization. Measure the percentage of signups completing the first meaningful action within 24 hours. If below 40 percent, the onboarding flow is broken; redesign the first-run experience. If 40 to 60 percent, run targeted experiments (in-product tooltips, onboarding emails, activation triggers). If above 60 percent, activation is healthy; focus moves to time-to-value.
Days 41 to 50: Time-to-value reduction. Measure the time from signup to first meaningful value delivered. For self-serve B2B saas, target 5 to 15 minutes. For sales-led, target 1 to 3 days. If time-to-value exceeds these targets, identify the friction (multi-step setup, integration requirements, manual configuration) and remove it. Time-to-value is the single biggest predictor of activation-to-paid conversion.
Days 51 to 60: Aha moment identification. The aha moment is the specific user action that correlates most strongly with retention. Common aha moments: “user invites their first teammate,” “user creates their first project,” “user connects their first integration.” Identify the saas product-market fit aha moment by comparing actions taken by retained users vs churned users. Once identified, redesign onboarding to push every user toward the aha moment in the first session.
The day-60 review checks two things. First, did activation and time-to-value reach the target ranges? Second, has the aha moment been identified and instrumented? If yes to both, days 61 to 90 focus on retention and the PMF decision. If no, days 61 to 90 must include continued onboarding work.
Days 61-90 of the Saas Product-Market Fit Hunt: Retention, NRR, and the Pivot Decision
Days 61 to 90 of the saas product-market fit hunt are the decisive phase. The first cohort reaches month-2 and month-3 retention checkpoints, NRR can be calculated, and the pivot/persevere/kill decision becomes possible.
Days 61 to 70: Cohort retention check. The week-1 cohort is now 60 to 70 days old. Plot the retention curve: what percentage of the original cohort is still active in week 2, week 4, week 6, week 8? A flat curve (stable retention after initial drop) is the strongest PMF signal. A declining curve (continuous attrition through every week) is the strongest no-PMF signal.
Days 71 to 80: NRR and word-of-mouth measurement. With 60+ days of data, calculate net revenue retention from the existing cohort: total revenue this month from week-1 cohort vs total revenue last month from same cohort, accounting for churn, upgrades, and downgrades. Measure word-of-mouth attribution: what percentage of new signups in days 60 to 80 came from referrals, brand search, or organic discovery? Both metrics inform the day-90 decision.
Days 81 to 90: PMF decision preparation. Run the Sean Ellis-style survey on the active user base. Compile the 7-signal scorecard from the Ledger. Schedule the pivot/persevere/kill decision meeting for day 90. The decision is a structured review of the 7 signals against thresholds, not a vibe call. The framework for the day-90 decision is covered in detail in a later section, alongside the worked example of a B2B saas in EU running this 90-day playbook end-to-end.
The day-90 outcome shapes everything that follows. Persevere with PMF means doubling down on growth: increasing CAC investment, hiring sales, expanding the team. Pivot means redirecting product effort to a different value proposition. Kill means stopping the build and returning capital. All three outcomes are valid; the wrong outcome at day 90 is “we will figure it out next month.”
Reading Retention Cohorts: The Saas Product-Market Fit Chart That Matters
The single most reliable saas product-market fit signal is the retention cohort curve. Every other metric correlates with PMF; retention curves cause it. A flat curve is the chart that proves PMF; a declining curve is the chart that disproves it.
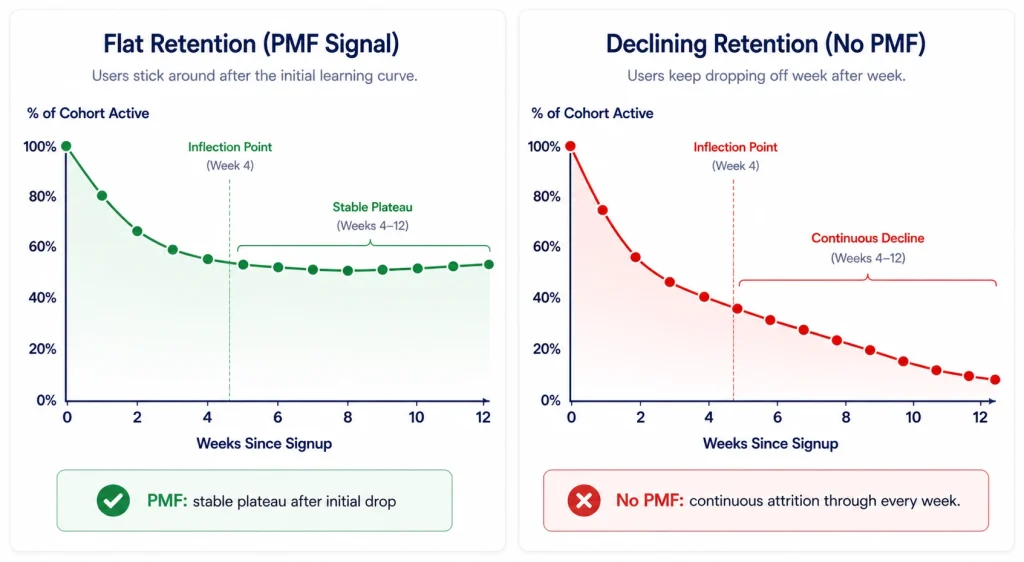
How to read a retention cohort curve. The x-axis is time since signup (weeks 0, 1, 2, 3 … 12). The y-axis is the percentage of the original cohort still active. The cohort always starts at 100 percent at week 0 and drops over time. The shape of the drop is what matters.
Flat curve (PMF signal). The cohort drops 30 to 50 percent in the first 2 to 4 weeks (the natural shake-out of users who signed up but did not engage), then plateaus at 40 to 60 percent for the next 8 to 12 weeks. Plateau means stable: week 5 retention is roughly equal to week 6, which is roughly equal to week 12. A flat plateau means the saas has found a user base that values it persistently. This is saas product-market fit.
Declining curve (no PMF). The cohort drops continuously week over week, with no plateau. Week 4 retention is 40 percent; week 8 is 25 percent; week 12 is 10 percent. The product retains nobody durably. This is the absence of saas product-market fit, regardless of how many new signups arrive each week.
The trap of replacement growth. A saas with declining retention can still grow on top-line metrics if new signups arrive faster than existing users churn. Founders see growing revenue and assume PMF; the retention chart reveals the leaky bucket. Replacement growth fails when the addressable market saturates or when CAC rises, both of which happen on 12 to 18 month timelines after launch.
Cohort cadence. Plot retention cohorts weekly for the first 90 days, then monthly thereafter. Compare week-1, week-4, and week-12 cohorts to detect whether the curve is improving as the product matures. The strongest PMF signal is the curve flattening earlier in successive cohorts (the week-12 cohort plateaus at 60 percent while the week-1 cohort plateaued at 45 percent), which means onboarding and product improvements are working.
The technical reference for retention cohort analysis is the Amplitude retention cohort guide, which covers cohort segmentation, retention curve interpretation, and the patterns that distinguish PMF from no-PMF in production saas data.
The Sean Ellis Test for Saas Product-Market Fit
The Sean Ellis test is the most cited qualitative measure of saas product-market fit. The test asks current users a single question: “How would you feel if you could no longer use this product?” The available answers: very disappointed, somewhat disappointed, not disappointed, no longer using.
The 40 percent threshold. When 40 percent or more of active users answer “very disappointed,” the saas has reached PMF by the Sean Ellis definition. Below 40 percent, the saas has not reached PMF; the gap between current and the threshold suggests how much product or positioning work remains.
Caveats that founders ignore. First, the survey must be sent only to active users (defined as users who have used the product in the past 14 days). Sending to all signups, including dormant accounts, dilutes the result and produces falsely low scores. Second, the sample size must be at least 30 active-user respondents; smaller samples are too noisy. Third, the 40 percent threshold is calibrated against B2B sales-led saas; B2C and PLG saas may show different patterns at PMF.
Why the test works. The “very disappointed” answer measures emotional dependence, which correlates with the underlying behavior (retention, willingness to recommend, willingness to pay) more reliably than NPS or CSAT. Users who would be very disappointed without the product are users who have integrated the product into their workflow.
Why the test misleads. Saas products with small user bases can score above 40 percent on Sean Ellis but still fail to reach PMF because the user base is unrepresentative (early adopters who would say “very disappointed” about almost any product they tried). The Sean Ellis test alongside retention cohort flatness is more reliable than either signal alone.
The canonical extension of the Sean Ellis test for saas product-market fit assessment is documented in the First Round Review essay on the Superhuman PMF engine, which covers how to act on Sean Ellis survey data systematically.
Qualitative Saas Product-Market Fit Signals: Customer Words vs Actions
Quantitative signals (retention, NRR, activation) measure what customers do. Qualitative signals measure what customers say. The two often disagree, and customer actions are the more reliable saas product-market fit indicator.
The “I love this product” trap. Customers who tell founders they love the product but do not return week over week are signaling politeness, not PMF. Customer interview enthusiasm does not predict retention; retention does.
The signals that matter qualitatively. Specific incidents where the customer used the product to solve a real problem (“yesterday I used it to do X, which would have taken me 2 hours otherwise”). Unprompted referrals to colleagues. Customer-initiated upgrade requests. Specific feature requests grounded in concrete workflows (rather than abstract preferences).
The signals that mislead qualitatively. Generic enthusiasm without specific incidents. “I would recommend this to anyone” statements. Feature requests without context. Customers who refuse to specify what would make them stop using the product.
Reconciling words and actions. When customers say they love the product but retention is declining, the truth is the retention chart. When customers say they have minor complaints but retention is flat, the truth is the retention chart. Quantitative signals override qualitative signals when the two disagree, because behavioral data is harder to fake than verbal data.
The right pattern: use qualitative signals to generate hypotheses about what to fix, then use quantitative signals to confirm whether the fixes work. The reverse pattern (quantitative signals alone, no customer conversations) misses why customers retain or churn, which is necessary for product iteration. The validation methodology that produces good qualitative signals is documented at how to validate a saas idea.
The Pivot/Persevere/Kill Saas Product-Market Fit Decision at Day 90
Day 90 of the saas product-market fit hunt is decision day. Three outcomes: persevere with PMF and scale, pivot to a different value proposition, or kill the saas and return capital. The decision is structured, not emotional.
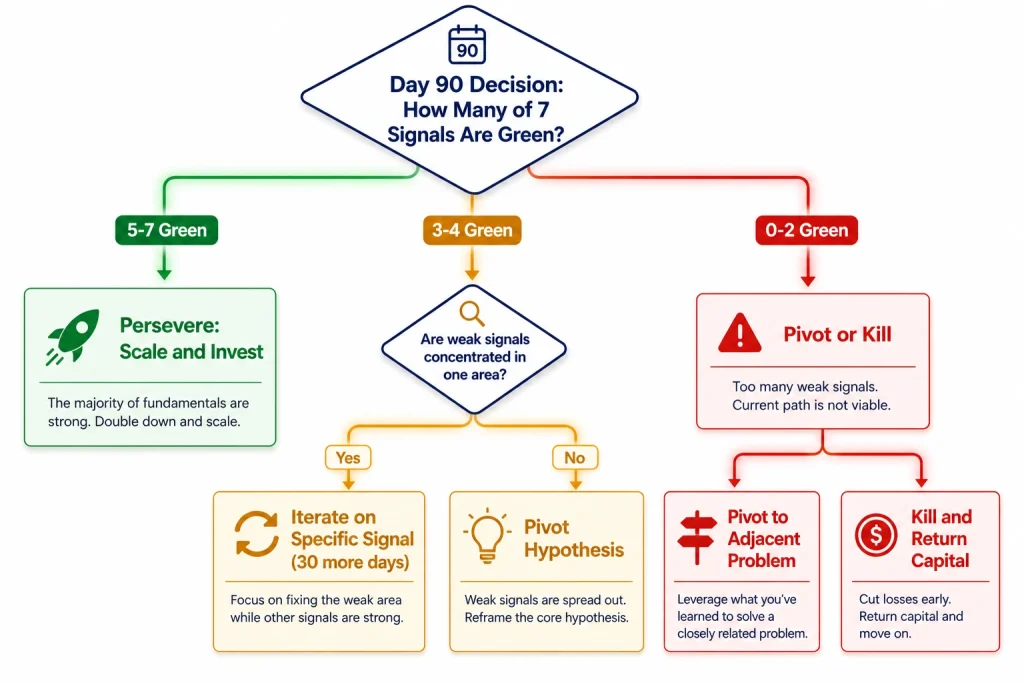
Persevere (5 to 7 green signals). The saas has PMF. Day 90 decision: scale. Increase CAC investment, hire sales (if sales-led) or growth (if PLG), expand the team, raise the seed round if not yet raised. The saas product-market fit hunt is over; the growth phase begins. Most resources that previously went into product iteration shift toward distribution.
Iterate (3 to 4 green signals). The saas is on a credible PMF trajectory but is not yet at PMF. Day 90 decision: extend the hunt by another 30 to 60 days, focused on the weakest signals. Common patterns: activation is healthy but retention is borderline (fix onboarding to drive earlier aha moment); retention is healthy but word-of-mouth is weak (fix positioning and case studies); time-to-value is slow but the rest is fine (fix onboarding flow). Iteration is not failure; it is structured continuation.
Pivot or kill (0 to 2 green signals). The saas is not finding PMF in the current form. Day 90 decision: pivot to an adjacent problem (different buyer, different solution to the same pain, different value proposition framing) or kill the saas and return capital. The pivot vs kill decision depends on whether the team has runway and learning that justifies a redirect. The 7 saas mvp mistakes patterns covered at saas mvp mistakes often appear in saas products at this outcome.
The day-90 decision is best run as a structured 90-minute meeting with the founding team, the lead investor (if any), and a trusted advisor. The agenda: review the 7-signal scorecard (15 minutes), review qualitative customer feedback (15 minutes), review the retention cohort chart (15 minutes), open discussion (30 minutes), commit to the decision (15 minutes). Decisions made by founder reflection alone tend toward optimism; decisions made in structured group settings with data tend toward truth.
The honest framing: “we will figure it out next month” is not a valid day-90 decision. If the data is unclear, the decision is iterate (with a defined 30-day plan and named owner per signal). Drift is the most expensive day-90 outcome.
Sales-Led vs Product-Led Paths to Saas Product-Market Fit
The path to saas product-market fit differs between sales-led and product-led motions. Founders who copy tactics from the wrong motion frequently miss PMF.
Sales-led PMF path. B2B saas with $10K+ ACV, multi-week sales cycles, contracts signed by named buyers. PMF signals: shortened sales cycles over time, increased deal sizes, repeat business from existing accounts, willingness to pay annually. The 90-day playbook focuses on positioning, sales-cycle compression, and per-deal economics.
Product-led PMF path. B2B or prosumer saas with self-serve onboarding, low-touch sales, conversion happening inside the product. PMF signals: high activation rates, fast time-to-value, organic word-of-mouth, low CAC, upgrade behavior from free to paid tiers. The 90-day playbook focuses on activation flow, aha moment instrumentation, and viral or referral mechanics.
The mistake of mixing motions. A sales-led saas optimizing for product-led signals (or vice versa) ends up with metrics that look fine in isolation but do not predict revenue. The motion determines which signals matter. Pick one motion explicitly at launch, optimize for its PMF signals, and switch only if the data forces the change.
Pricing Experiments During the Saas Product-Market Fit 90 Days
Pricing during the saas product-market fit hunt is a deliberate experiment, not a fixed decision. The right pricing reveals itself through customer willingness-to-pay data over the 90 days.
Days 1 to 30: launch with the validation pricing. Whatever pricing tier customers committed to in pre-sells becomes the launch price. Do not change it during the first 30 days; the noise of launch obscures pricing signal.
Days 31 to 60: test pricing variations on new signups. A/B test 20 to 30 percent price changes on cohorts of new signups. Measure conversion impact, churn impact, and customer feedback. Pricing changes affect retention with a 30 to 60 day lag; the experiment needs full 30-day data before decisions.
Days 61 to 90: lock pricing for the next quarter. Based on the experimentation data, set pricing for the next quarter. Avoid running ongoing pricing experiments past day 90; the saas needs pricing stability for word-of-mouth and case studies to compound.
The trap of pricing during PMF hunt: discounting heavily to drive conversions. Discounted customers have lower retention, lower NRR, and lower willingness to refer. Holding price discipline during the hunt produces stronger PMF signal than discounting; the discounted growth often masks the absence of PMF.
After Saas Product-Market Fit: What Breaks and Why
Reaching saas product-market fit is celebration-worthy. The week after, founders discover that the metrics that worked during the PMF hunt no longer scale.
Activation rate. At PMF, activation rate often declines as the user base broadens beyond the early-adopter cohort. The fix: re-instrument activation, identify the new user segment’s aha moment, and rebuild onboarding for the broader audience.
Word-of-mouth. Organic share grows during PMF hunt but plateaus as the early addressable market saturates. Founders who relied on word-of-mouth alone discover at scale that paid acquisition is required to sustain growth.
Sales-cycle length. Compressed during PMF discovery as positioning sharpened, but expands again at scale as the team starts selling to less-natural-fit customers.
Team and process. The 3 to 4 person team that found PMF is the wrong shape for the 10 to 20 person team that scales it. Hiring, process, and decision-making all need to evolve.
The pattern across all four: the metrics that signal PMF do not signal post-PMF growth; the playbook needs to switch. Founders who continue running the PMF playbook after PMF stall the saas at $1M to $3M ARR. The post-PMF playbook (growth-stage operations, sales hiring, channel diversification) is a different topic, not covered in this article.
A Worked Example: 90 Days of Saas Product-Market Fit (B2B EU)
A worked example anchors the methodology. The hypothetical saas: a B2B compliance-management tool for EU mid-market companies preparing for the AI Act, launched in early 2026 with $40K MVP build cost and 5 pre-sell customers.
Days 1 to 30 (Instrumentation). Team launches the product with PostHog instrumented for 12 funnel events. First-week cohort: 18 paid signups (5 pre-sells plus 13 organic), 11 reach activation in 24 hours (61 percent), average time-to-value is 12 minutes for self-serve, 2 days for sales-led. Day-30 review: instrumentation working correctly, activation borderline-good, time-to-value within range. No red flags.
Days 31 to 60 (Activation and Aha). Team identifies the aha moment as “user uploads first compliance document and receives the AI-generated risk assessment.” Onboarding gets redesigned to push every new user toward this action in the first session. Activation rate climbs from 61 percent to 73 percent over the 30 days. Cohort 5 (week 5 signups) shows week-2 retention of 68 percent, vs cohort 1’s 52 percent. The improvement is statistically meaningful.
Days 61 to 90 (Retention and Decision). Cohort 1 is now 12 weeks old. Retention curve: 100 percent at week 0, 65 percent at week 4, 58 percent at week 8, 56 percent at week 12. Flat plateau confirmed. NRR for cohort 1: 112 percent (3 customers upgraded plans, no churn). Word-of-mouth attribution: 38 percent of new signups in days 60 to 90 came from referral or brand search. Sean Ellis test on active users: 47 percent answered “very disappointed.” Sales-cycle length compressed 31 percent vs launch baseline.
Day 90 decision. 7-signal scorecard: 6 of 7 green (retention flat, word-of-mouth above 30 percent, activation above 60 percent, time-to-value within range, NRR above 110 percent, sales-cycle compression above 25 percent, payback period at 16 months — borderline amber). Decision: persevere with PMF, raise seed round, hire sales lead.
The example illustrates the discipline. Each phase produced the data needed for the next phase. The day-90 decision was data-driven, not founder-driven. The 7-signal scorecard at 6 green produced clear signal; if the scorecard had been 3 green, the decision would have been iterate, not persevere. The methodology is reproducible across saas products and verticals.
Conclusion: Saas Product-Market Fit Is a Discipline, Not a Destination
Saas product-market fit is the threshold at which a saas retains users durably, generates word-of-mouth, and converts trials profitably. The 7 powerful signals (retention, word-of-mouth, activation, time-to-value, payback, NRR, sales-cycle compression) make the threshold measurable. The 90-Day PMF Ledger turns the hunt into a structured weekly review. The retention cohort curve is the single most reliable signal; flat plateaus indicate PMF, declining curves indicate the absence of it. The Pivot/Persevere/Kill decision at day 90 is data-driven and time-bound, not vibe-based.
The dominant pattern across saas product-market fit outcomes in 2026: founders who run the disciplined 90-day playbook produce clear go/no-go signals at day 90, regardless of which way the signal points. Founders who skip the discipline drift through months 3 to 12 with ambiguous data, missed pivot opportunities, and exhausted runway. Both PMF and no-PMF are valid outcomes; ambiguity is not.
Saas Product-Market Fit FAQ
1. How do I know if I have saas product-market fit?
Run the 7-signal scorecard from this article. 5 to 7 green signals at day 90 indicates PMF. 3 to 4 green signals indicates iteration is needed; 0 to 2 indicates pivot or kill. The single most reliable signal is the retention cohort curve flatness; if your week-4 retention plateau holds through week 12, the saas has PMF regardless of other metrics.
2. Is 90 days enough to reach saas product-market fit?
Sometimes. Roughly 30 percent of saas products that find PMF do so within 90 days of launch; another 40 percent reach PMF in 90 to 270 days; the remaining 30 percent either pivot or kill. The 90-day playbook produces the data needed to decide; reaching PMF inside 90 days depends on the underlying validation work done before launch.
3. What is a strong retention rate signal for B2B saas product-market fit?
For B2B sales-led saas: 50 to 65 percent week-12 retention with a flat plateau is a clear PMF signal. For B2B PLG saas: 35 to 50 percent week-12 retention with flat plateau. For consumer prosumer saas: 25 to 40 percent week-12 retention with flat plateau. The flatness matters more than the absolute number; declining curves at any retention level signal no PMF.
4. Should I iterate or pivot at day 90?
Iterate when 3 to 4 of 7 signals are green and the weak signals concentrate in one area (activation, time-to-value, or onboarding). Pivot when 0 to 2 signals are green and the weak signals span multiple areas (retention, NRR, word-of-mouth all weak). Iteration extends the hunt by 30 to 60 days; pivot redirects the saas to a different value proposition entirely.
5. Can a saas reach product-market fit without a sales team?
Yes for product-led growth motions. Self-serve B2B saas (Notion, Linear in early stages, Calendly, Loom) reached PMF without traditional sales teams; the product itself was the sales motion. Sales-led B2B saas (Salesforce, HubSpot enterprise, Snowflake) reached PMF with sales teams as the dominant acquisition motion. The right answer depends on the motion, not the desire to skip sales work.
6. How does saas product-market fit differ for PLG vs sales-led?
PLG PMF emphasizes activation, time-to-value, and viral coefficient. Sales-led PMF emphasizes deal size, sales-cycle compression, and account-level retention. The 7-signal scorecard applies to both, but the threshold for each signal differs by motion. Founders should not compare their PLG signals to sales-led benchmarks; the bands are calibrated separately.
7. What is a strong activation rate at 30 days for saas product-market fit?
50 to 70 percent of signups completing the first meaningful action within 24 hours is the band of healthy saas. Below 40 percent at 30 days, the onboarding is broken and needs redesign before PMF can be assessed. Above 75 percent, the activation event is set too low (counted as “logged in” rather than a substantive action) and should be redefined to require deeper engagement.