The American on-demand service marketplace has transformed into a $57.6 billion industry, fundamentally reshaping how consumers access home services across all 50 states.
This digital revolution connects millions of service providers with customers seeking everything from plumbing and electrical work to wellness services and home maintenance. For platform developers and entrepreneurs, this creates unprecedented opportunities in the rapidly growing US service marketplace.
However, beneath this growth lies a complex web of state-specific regulations that can make or break your platform venture.
The Regulatory Challenge: A Strategic Framework
Unlike many countries with unified national frameworks, the United States presents a unique challenge that requires a systematic approach:
The 50-State Reality Framework:
- 50 different states = 50 different regulatory frameworks
- Varying licensing requirements creating operational complexity
- Complex tax structures requiring sophisticated compliance systems
- Worker classification laws determining your entire business model
The fragmented nature of state compliance in the American home services platform sector demands more than just awareness, it requires a strategic framework for navigation and growth.
Your Roadmap to Success
This comprehensive guide provides you with:
- Market Intelligence Framework – Data-driven insights for each major state
- Compliance Playbook – Step-by-step regulatory navigation
- Risk Mitigation Strategies – Proven approaches to avoid costly mistakes
- Growth Acceleration Blueprint – Scalable expansion methodologies
Let’s transform regulatory complexity into competitive advantage.
Chapter 1: State-by-State Market Analysis
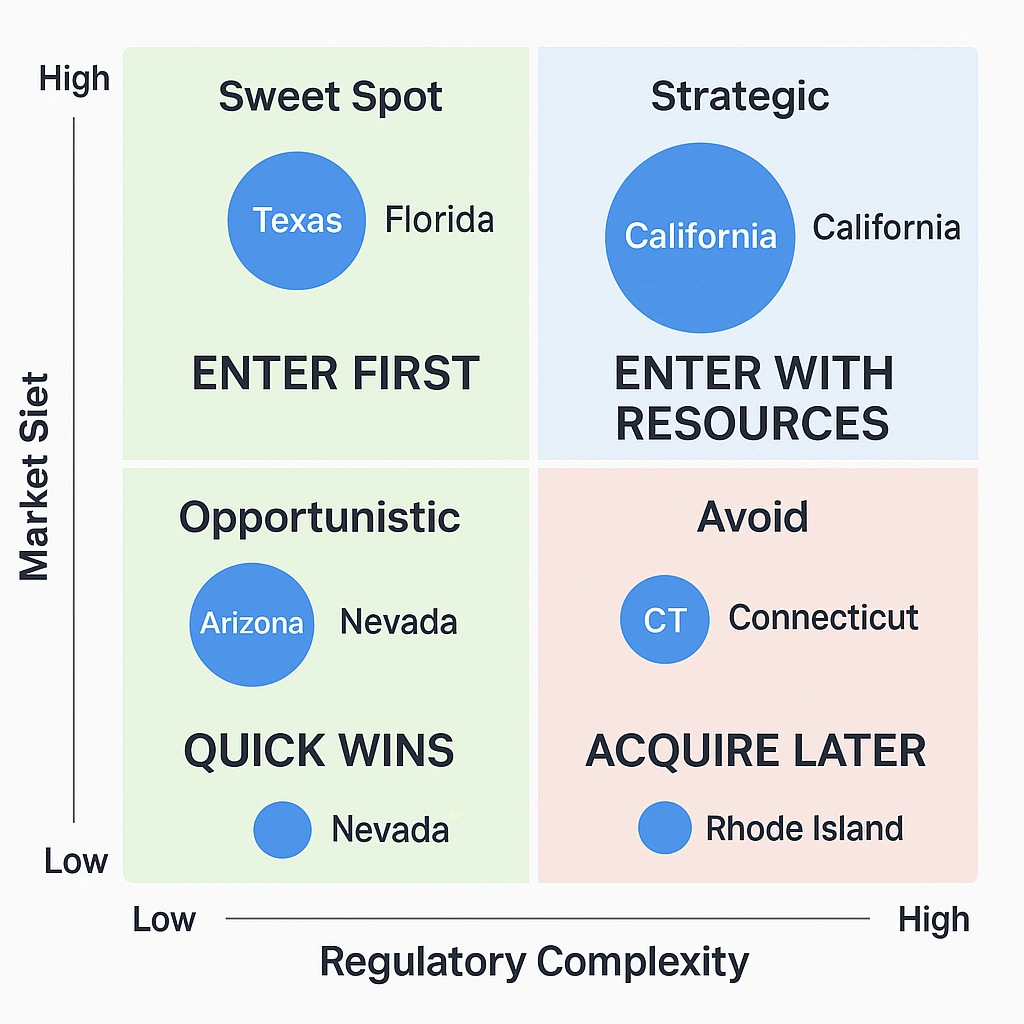
The American market isn’t monolithic, it’s a mosaic of opportunities waiting to be unlocked. Each state operates as its own ecosystem with unique consumer behaviors, regulatory environments, and growth trajectories. This chapter provides you with the Market Opportunity Matrix™ to identify and prioritize your expansion targets strategically.
Understanding Regional Market Dynamics in the US Service Marketplace
The American on-demand service marketplace exhibits significant regional variations that directly impact your platform’s success potential. Let’s analyze each major market through our comprehensive evaluation framework.
The Market Opportunity Matrix™
We evaluate each state across four critical dimensions:
- Market Size & Growth (Population, GDP, Service Demand)
- Regulatory Complexity (Licensing, Tax, Worker Laws)
- Competition Intensity (Existing Players, Market Saturation)
- Operational Feasibility (Infrastructure, Talent, Costs)
California: The Golden Opportunity
California dominates the landscape with compelling metrics that demand attention:
| Market Metrics | California Data | National Rank |
|---|---|---|
| Addressable Market | $12.3 billion | #1 (21% of total) |
| Population | 39.5 million | #1 |
| Per-Capita Spending | $312/year | #1 |
| Smartphone Penetration | 87% | #2 |
| Service Provider Density | 1 per 450 residents | #3 |
| Average Transaction Value | $127 | #1 |
Strategic Considerations Framework:
| Strategy Component | Recommendation | Timeline | Investment |
|---|---|---|---|
| Entry Strategy | Start in Sacramento/San Diego | Month 1-3 | $100-200K |
| Compliance Priority | AB5 legal structure setup | Pre-launch | $50-75K |
| Differentiation | Quality & trust focus | Ongoing | $150K/year |
| Market Expansion | SF/LA after validation | Month 7-12 | $500K-1M |
Platform developers gain first-mover advantages in emerging service categories while established players dominate traditional segments.
Texas: The Growth Accelerator
Texas offers the optimal blend of opportunity and accessibility:
Growth Dynamics Framework:
- No state income tax reducing operational costs by 5-7%
- 15.9% population growth creating 2.5M new potential users
- $8.9 billion market opportunity across major metros
- Business-friendly regulations accelerating launch timelines
The Texas Playbook:
- Austin First: Tech-savvy market for proof of concept
- Houston/Dallas Expansion: Scale with proven model
- Rural Opportunity: Underserved markets with less competition
- Partnership Strategy: Leverage local business networks
Texas serves as the ideal laboratory for testing new features, pricing models, and service categories before national rollout.
New York: The Complexity-Reward Equation
New York exemplifies the high-risk, high-reward market dynamic:
The New York Success Framework:
Phase 1: Market Entry Preparation
- Secure $1M+ in compliance budget
- Build relationships with state regulators
- Establish local legal partnerships
- Create NY-specific platform features
Phase 2: Strategic Launch
- Manhattan Last Strategy: Start in Brooklyn/Queens for lower costs
- Density Optimization: Focus on ZIP codes with 50K+ residents
- Premium Positioning: NY consumers pay 40% more for convenience
- Multi-lingual Support: Essential for 37% foreign-born population
ROI Projection Model:
- Initial Investment: $1.5M
- Break-even Timeline: 18-24 months
- 5-Year Revenue Potential: $50M+
- Market Share Target: 3-5% achievable
Despite regulatory hurdles, New York’s $8.7 billion market and affluent demographics make it indispensable for national credibility.
Florida: The Demographic Goldmine
Florida’s unique population dynamics create specialized opportunities:
The Florida Opportunity Framework:
Demographic Segments:
- Retirees (21% of population): Home maintenance, healthcare support
- Tourists (137M annually): Vacation rental services, short-term needs
- Latin Market (26% Hispanic): Bilingual platform requirements
- Remote Workers (Growing 30% YoY): Professional services demand
Regional Strategy Map:
- Miami-Dade: International gateway, premium services
- Orlando: Family services, theme park adjacency
- Tampa Bay: Balanced market, steady growth
- Jacksonville: Underserved, low competition
Seasonal Optimization Model:
- Q1-Q2: Peak season (120% normal demand)
- Q3: Hurricane prep services spike
- Q4: Holiday service surge
- Year-round base: 21.5M residents
Florida’s balanced regulations and diverse demand patterns support specialized platform strategies.
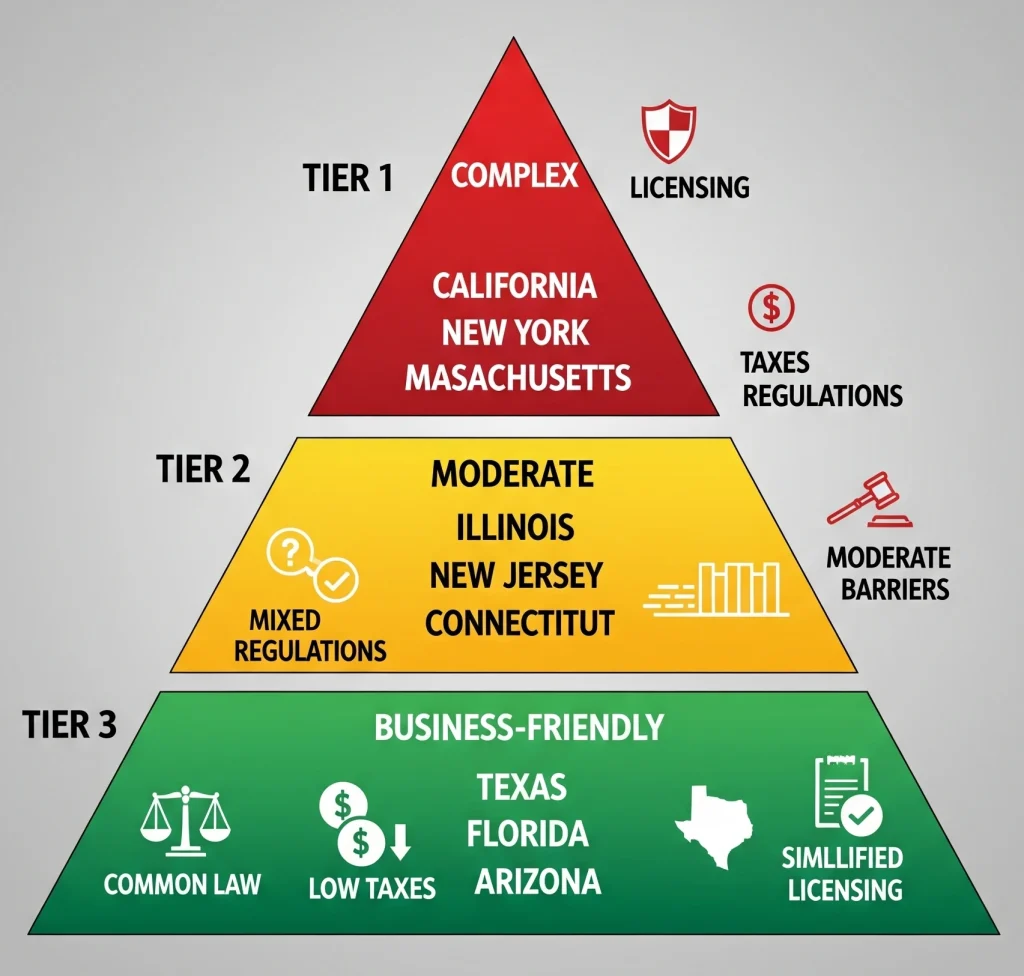
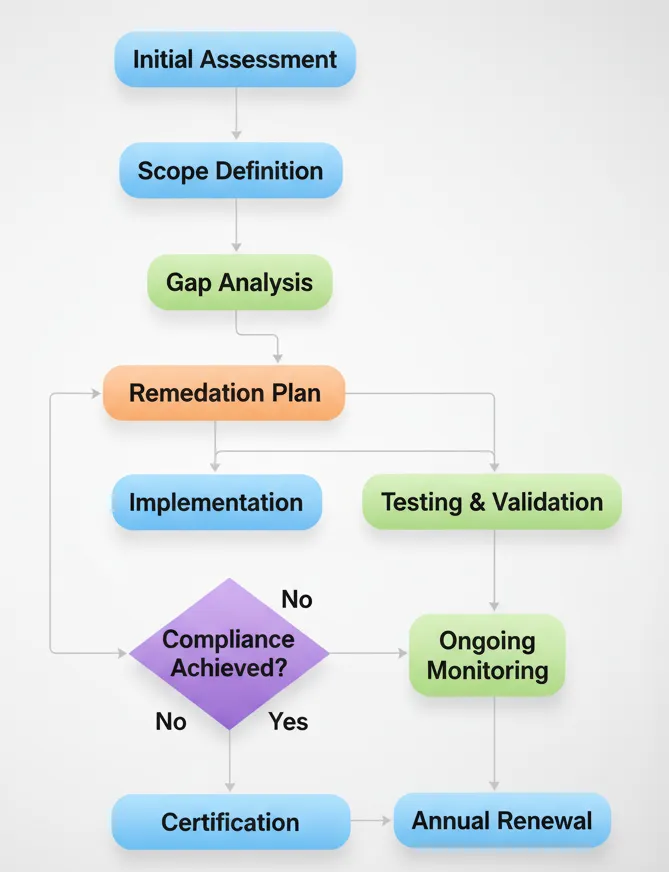
State Compliance Complexity Tiers
Chapter 2: Licensing & Regulatory Compliance
Licensing isn’t just red tape, it’s your platform’s trust foundation. This chapter transforms the complex maze of state licensing requirements into a systematic Compliance Automation Framework™ that scales with your growth while protecting your platform from legal exposure.
Navigating State Licensing Requirements for Service Providers
State licensing requirements form the cornerstone of platform credibility in any US service economy platform. Let’s build your compliance infrastructure using proven frameworks and automation strategies.
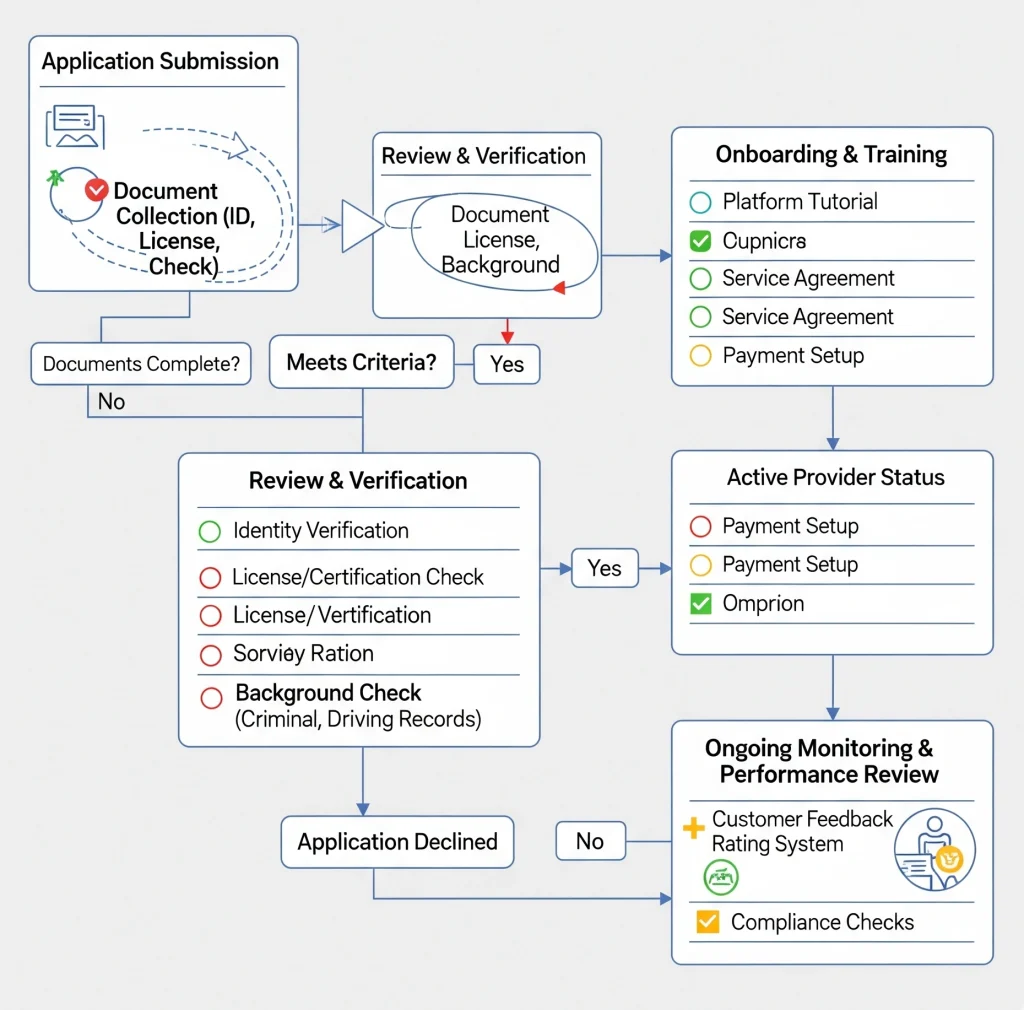
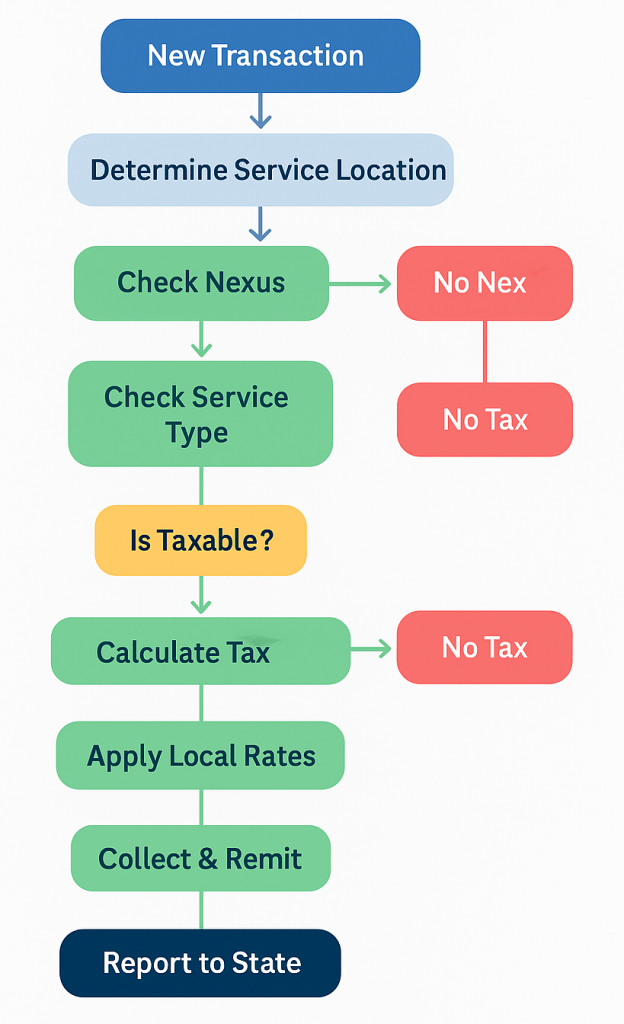
Provider Onboarding Compliance Flow:
The Licensing Complexity Matrix
Understanding licensing requires a three-dimensional approach:
Dimension 1: Geographic Variation
| State | Contractor License Threshold | Processing Time | Annual Cost | Renewal Period |
|---|---|---|---|---|
| California | $500+ | 45-60 days | $450 | 2 years |
| Texas | $50,000+ | 10-15 days | $115 | 1 year |
| Florida | Varies by county | 20-30 days | $250-500 | 2 years |
| New York | $5,000+ NYC | 30-45 days | $400+ | 2-3 years |
| Arizona | No state requirement | N/A | Varies | N/A |
Dimension 2: Service Categories
| Service Category | Typical License Required | States Requiring | Average Cost | Insurance Required |
|---|---|---|---|---|
| Electrical | Master/Journeyman Electrician | All 50 | $300-800/year | Yes – $1M+ |
| Plumbing | Master/Journeyman Plumber | All 50 | $200-600/year | Yes – $500K+ |
| HVAC | HVAC Contractor | 48 states | $250-1000/year | Yes – $1M+ |
| Handyman | General Contractor (varies) | 35 states | $100-500/year | Sometimes |
| Cleaning | Business License Only | 15 states | $50-200/year | Optional |
| Pet Services | Animal Care License | 20 states | $100-300/year | Recommended |
Dimension 3: License Types
- Individual Practitioner: Personal certification
- Business Entity: Company-level requirements
- Specialty Endorsements: Additional service permissions
- Reciprocity Agreements: Cross-state recognition
The Compliance Automation Framework™
Layer 1: Intelligent Verification Infrastructure
Build a system that thinks ahead:
Implementation Strategy:
- Week 1-2: Map requirements for target states
- Week 3-4: Integrate with 3rd party verification APIs
- Week 5-6: Build provider dashboard interfaces
- Week 7-8: Test and deploy automation rules
Layer 2: Progressive Compliance Protocol
According to the National Conference of State Legislatures, managing 1,100+ occupation types requires intelligent prioritization:
Priority Tier System:
- Critical (Immediate): Licenses affecting safety/liability
- Important (30 days): Professional certifications
- Standard (60 days): Business registrations
- Optional (Ongoing): Additional credentials
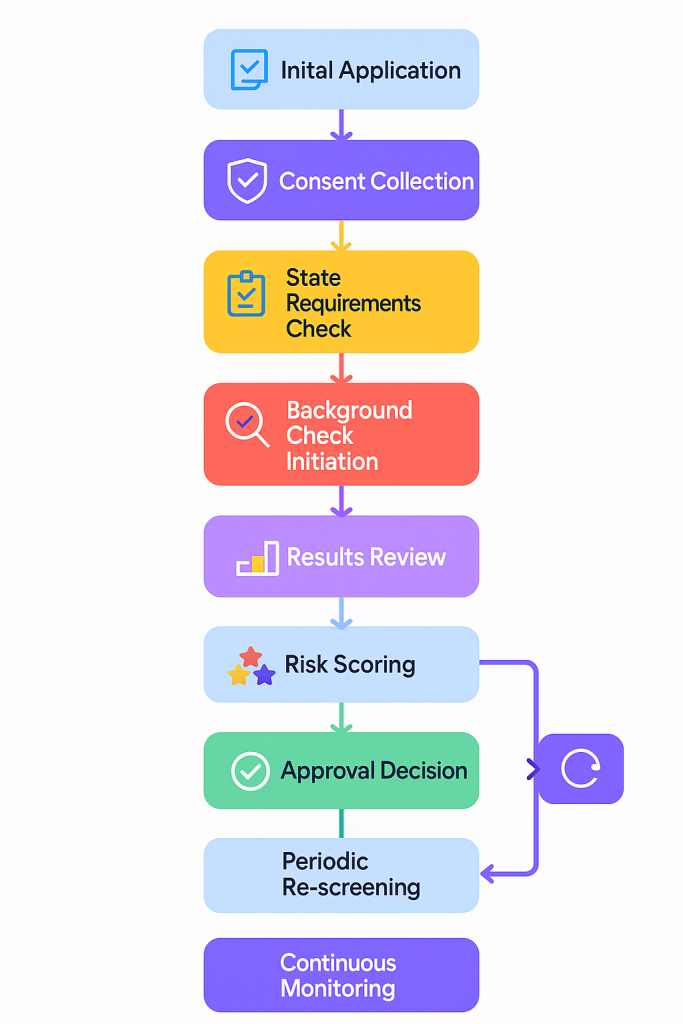
Layer 3: Background Check Orchestration
Create a unified screening process across diverse state requirements:
The Smart Screening Framework:
- Pennsylvania Protocol: Child abuse clearance + Criminal + FBI
- Massachusetts Method: CORI + SORI + Federal checks
- California Comprehensive: LiveScan + DOJ + FBI fingerprinting
- Texas Basic: State criminal + National database
Background Check Process Flow:
Automation Rules Engine:
IF service_category = "child_care" THEN
   REQUIRE child_abuse_clearance
   REQUIRE enhanced_background
   SET recurring_check = "annual"
ELSE IF service_category = "general_handyman" THEN
   REQUIRE basic_criminal
   SET recurring_check = "biennial"
Risk Mitigation Through Technology
Transform compliance from cost center to competitive advantage:
The Platform Protection Protocol:
- Automated License Monitoring
- • Daily API calls to state databases
- • 60/30/7-day expiration warnings
- • Automatic service suspension for expired licenses
- • Provider re-activation workflows
- Audit Trail Architecture
- • Every verification timestamped
- • All documents encrypted and stored
- • Change history maintained
- • Regulatory reporting ready
- Liability Firewall System
- • Service matching prevents unlicensed work
- • Geographic restrictions enforce boundaries
- • Category limitations maintain compliance
- • Real-time alerts for violations
The development of comprehensive verification and rating systems becomes your platform’s competitive moat.
Chapter 3: Tax Compliance Framework
Taxes in the digital economy aren’t just about rates, they’re about survival. With states aggressively pursuing platforms for back taxes and penalties, a single compliance failure can destroy years of growth. This chapter provides the Tax Intelligence System™ that turns complexity into competitive advantage.
Managing Multi-State Tax Obligations for American Service Platforms
Tax compliance for the American on-demand service marketplace requires sophisticated orchestration across multiple jurisdictions. Let’s build your tax infrastructure using battle-tested frameworks.
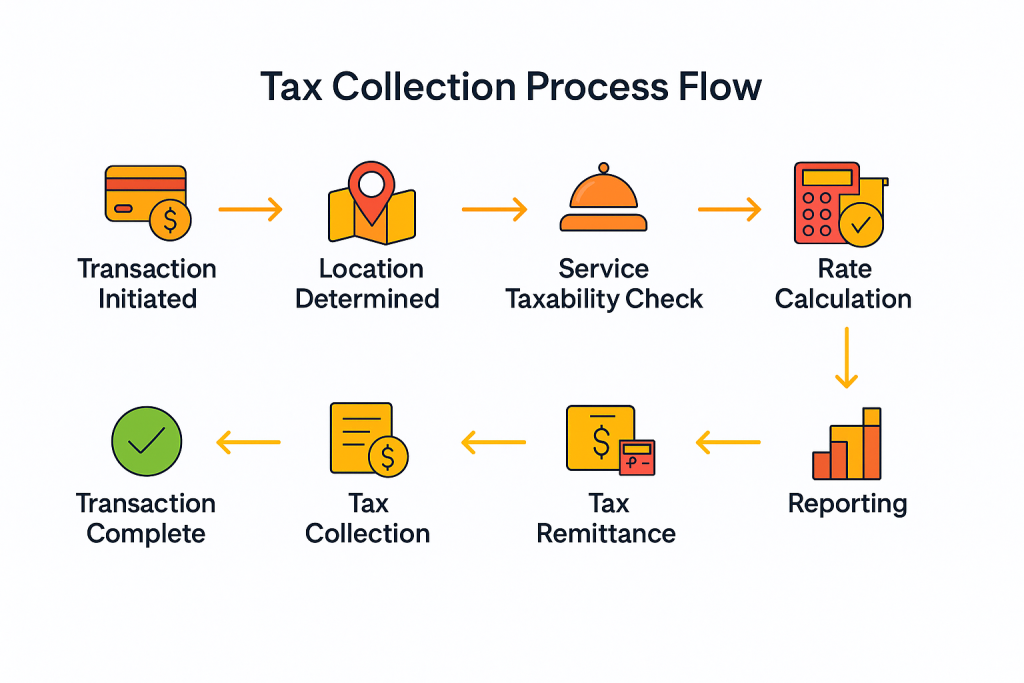
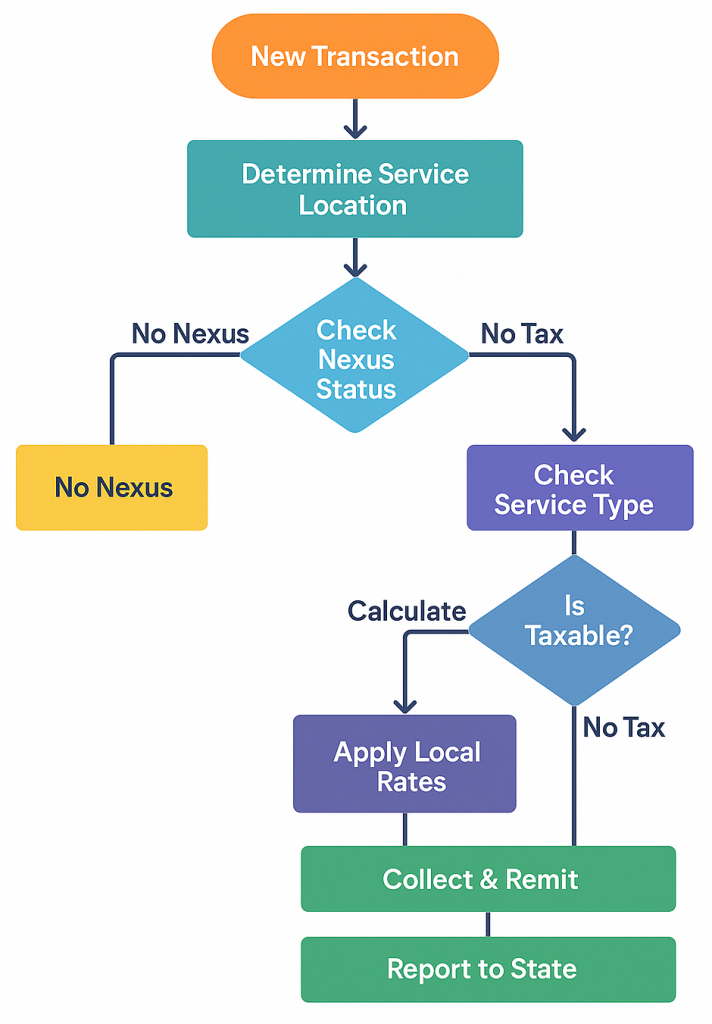
Tax Collection Process Flow:
The Economic Nexus Revolution
The 2018 Wayfair decision created a new reality that demands strategic response:
The Nexus Trigger Framework:
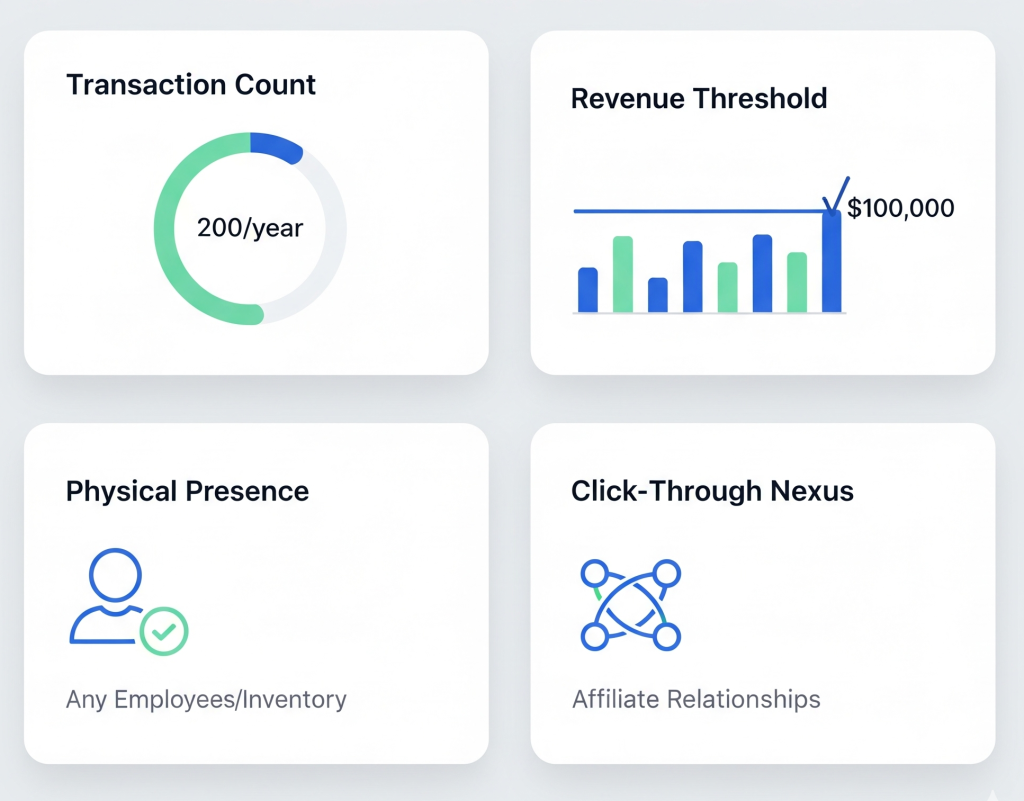
Strategic Nexus Management:
- Pre-Nexus Phase: Monitor approaching thresholds
- Trigger Point: Register before exceeding limits
- Compliance Phase: Collect and remit from day one
- Audit Ready: Maintain defensible positions
The Multi-Dimensional Tax Matrix
Understanding tax obligations across three critical dimensions:
Dimension 1: Rate Complexity
| Tax Category | States | Base Rate | Local Add-On | Total Possible |
|---|---|---|---|---|
| Zero Tax States | Oregon, Montana, Delaware, New Hampshire, Alaska | 0% | 0-3.5% (Alaska only) | 0-3.5% |
| Low Tax States | Colorado, Alabama, Georgia, Hawaii, Wyoming | 2.9-4.5% | 0-5% | 2.9-9.5% |
| Moderate Tax States | Arizona, Florida, Texas, Virginia, Maryland | 5-6% | 0-3% | 5-9% |
| High Tax States | California, Tennessee, Louisiana, Arkansas, Washington | 6.5-7.5% | 0-4.75% | 6.5-12.25% |
Sales Tax Comparison Table:
| State | State Rate | Avg Local Rate | Combined Avg | Max Possible | Services Taxed |
|---|---|---|---|---|---|
| California | 7.25% | 1.57% | 8.82% | 10.25% | 30 services |
| Texas | 6.25% | 1.94% | 8.19% | 8.25% | 80 services |
| New York | 4.00% | 4.52% | 8.52% | 8.875% | 155 services |
| Florida | 6.00% | 1.05% | 7.05% | 8.5% | 65 services |
| Oregon | 0.00% | 0.00% | 0.00% | 0.00% | N/A |
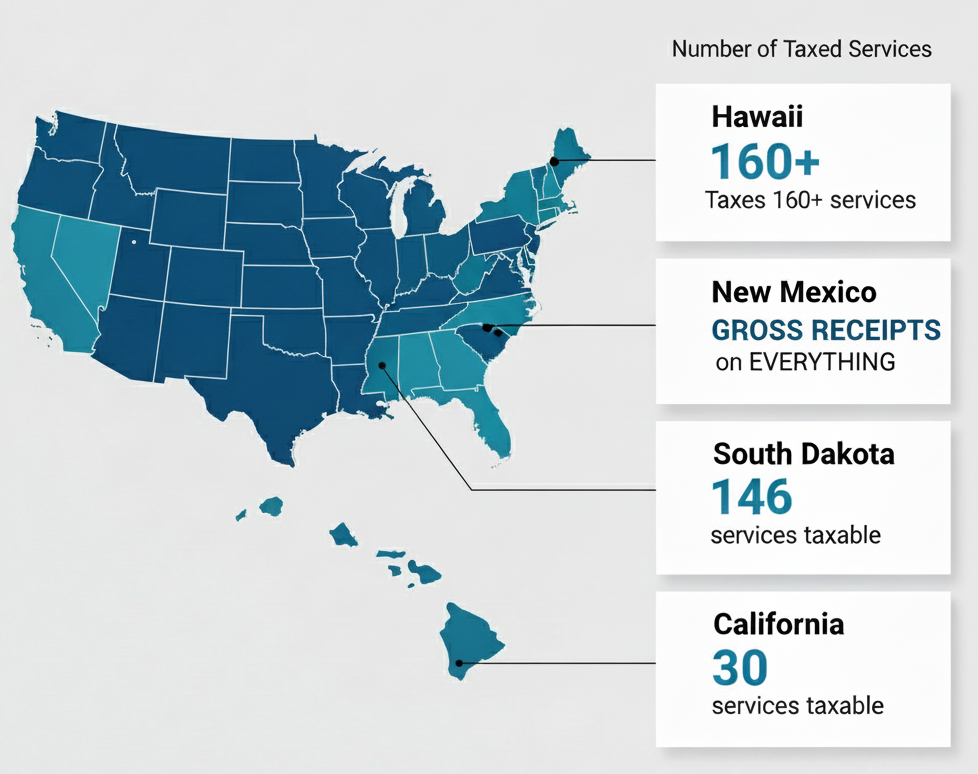
Dimension 2: Service Taxability
The Tax Foundation reveals dramatic variations:
Service Taxation Spectrum:
Dimension 3: Marketplace Facilitator Laws
| State | Economic Nexus Threshold | Transaction Threshold | Effective Date | Platform Liability |
|---|---|---|---|---|
| California | $500,000 | None | Oct 2019 | Full |
| Texas | $500,000 | None | Oct 2019 | Full |
| New York | $500,000 & 100 trans | Both required | Jun 2019 | Full |
| Florida | $100,000 | None | Jul 2021 | Full |
| Illinois | $100,000 | 200 transactions | Jul 2020 | Full |
States requiring platform tax collection:
- 43 states with marketplace facilitator laws
- $100K or 200 transactions typical thresholds
- Retroactive liability risk in some states
- Audit exposure for historical non-compliance
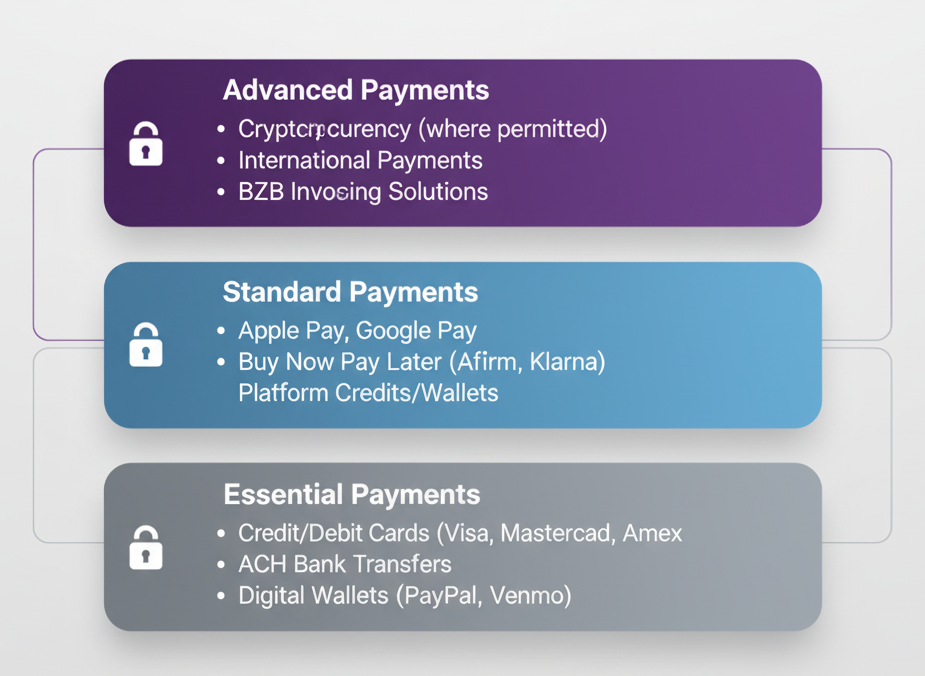
Payment Compliance Stack
The 1099 Revolution Strategy
New IRS rules fundamentally change platform economics:
The $600 Threshold Impact:
Previous Reality → New Reality
$20,000 threshold → $600 threshold
33x more providers affected
10x increase in reporting burden
Exponential compliance complexity
1099 Processing Workflow:
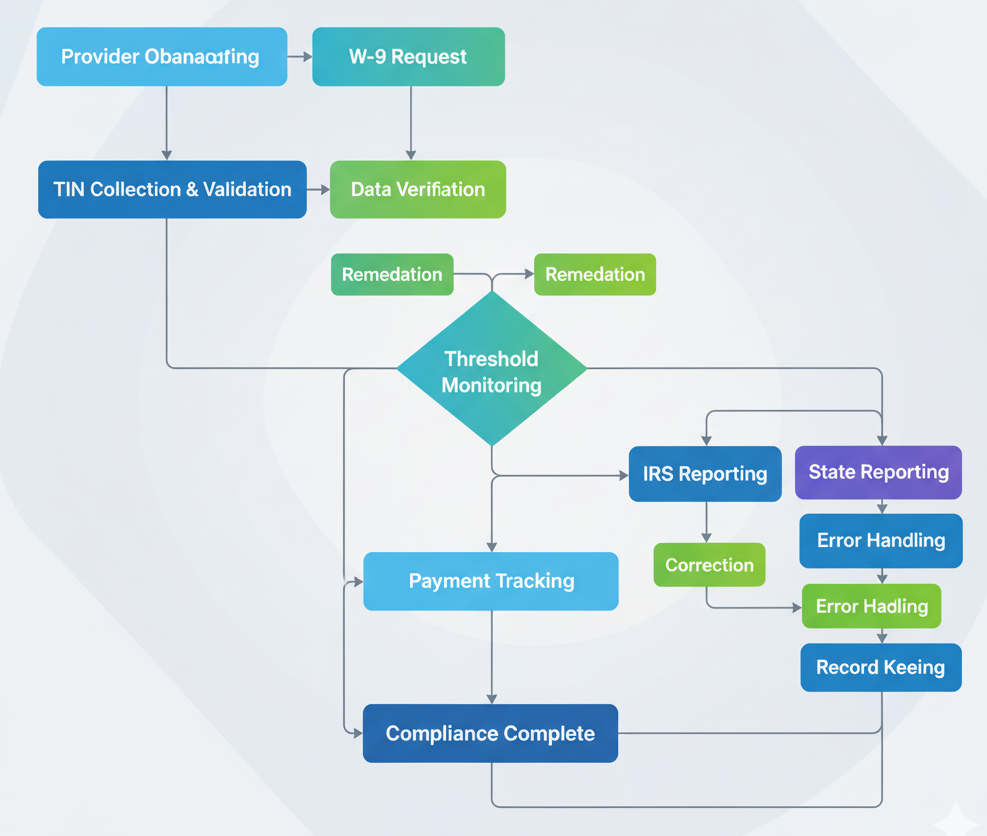
1099 Automation Framework:
- Data Collection Pipeline
- • TIN verification at onboarding
- • B-9 collection automation
- • Address standardization
- • Backup withholding triggers
- Reporting Orchestration
- • Federal 1099-K generation
- • State-specific 1099 variants
- • Combined federal/state filing
- • Provider portal access
- Exception Management
- • Missing TIN protocols
- • Backup withholding (24%)
- • Disputed amounts process
- • Amended return procedures
The Marketplace Facilitator Playbook
Transform facilitator obligations into operational excellence:
Phase 1: Infrastructure Development
Week 1-2: Tax engine selection/integration
Week 3-4: Rate table implementation
Week 5-6: Reporting system build
Week 7-8: Testing and validation
Phase 2: Operational Excellence
Daily Operations:
- Real-time tax calculation
- Automatic rate updates
- Transaction logging
- Exception handling
Monthly Procedures:
- Reconciliation processes
- Filing preparation
- Audit trail review
- Provider statements
Quarterly Requirements:
- State return filing
- Nexus evaluation
- Rate table updates
- Compliance audits
Technology Stack Recommendations:
- Tax Calculation: Avalara, TaxJar, or Vertex
- 1099 Processing: Track1099, Tax1099, or Sovos
- Compliance Management: Thompson Reuters ONESOURCE
- Audit Defense: Professional services retainer
Consider implementing comprehensive payment processing systems with built-in tax compliance.
Chapter 4: Worker Classification Laws
The classification battlefield determines whether your platform thrives or dies. One misclassification lawsuit can trigger millions in penalties, destroy unit economics, and force complete business model restructuring. This chapter provides the Classification Defense System™ that keeps you on the right side of evolving laws.
Understanding Independent Contractor vs. Employee Status Across States
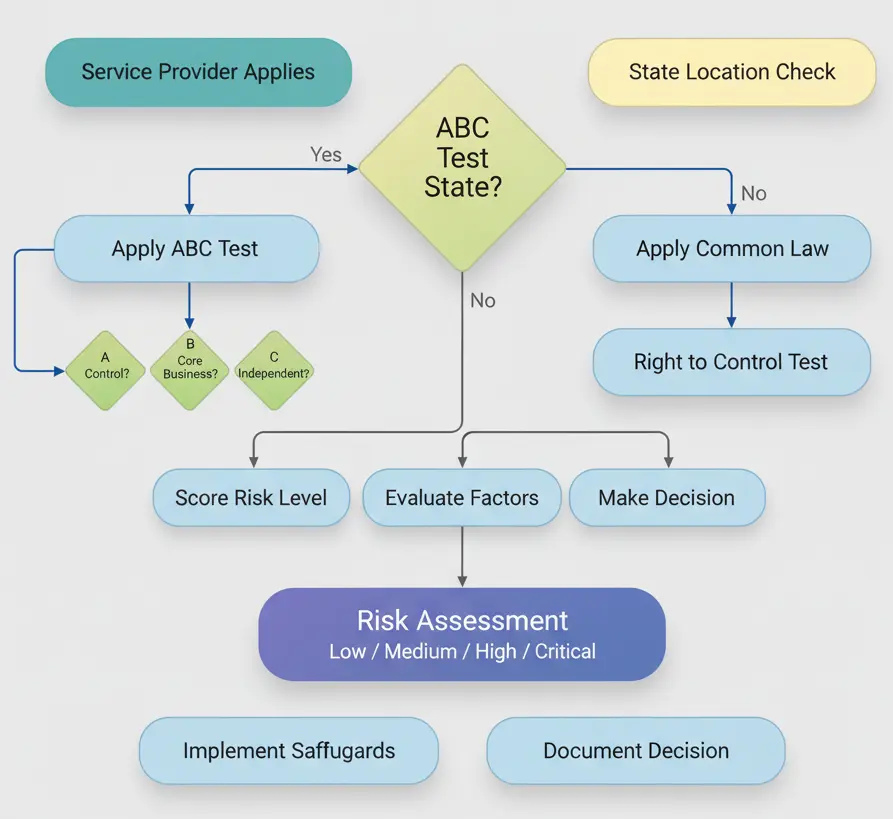
Worker classification in the American home services platform industry isn’t just legal semantics—it’s existential. Let’s build your classification framework using proven defense strategies.
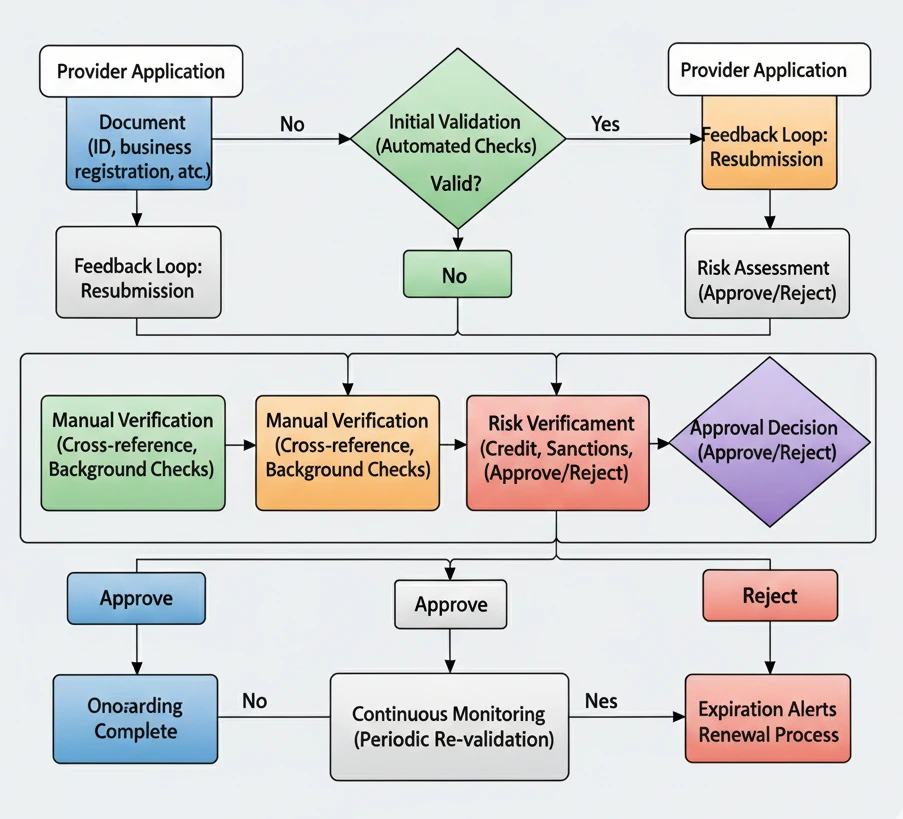
Worker Classification Assessment Flow:
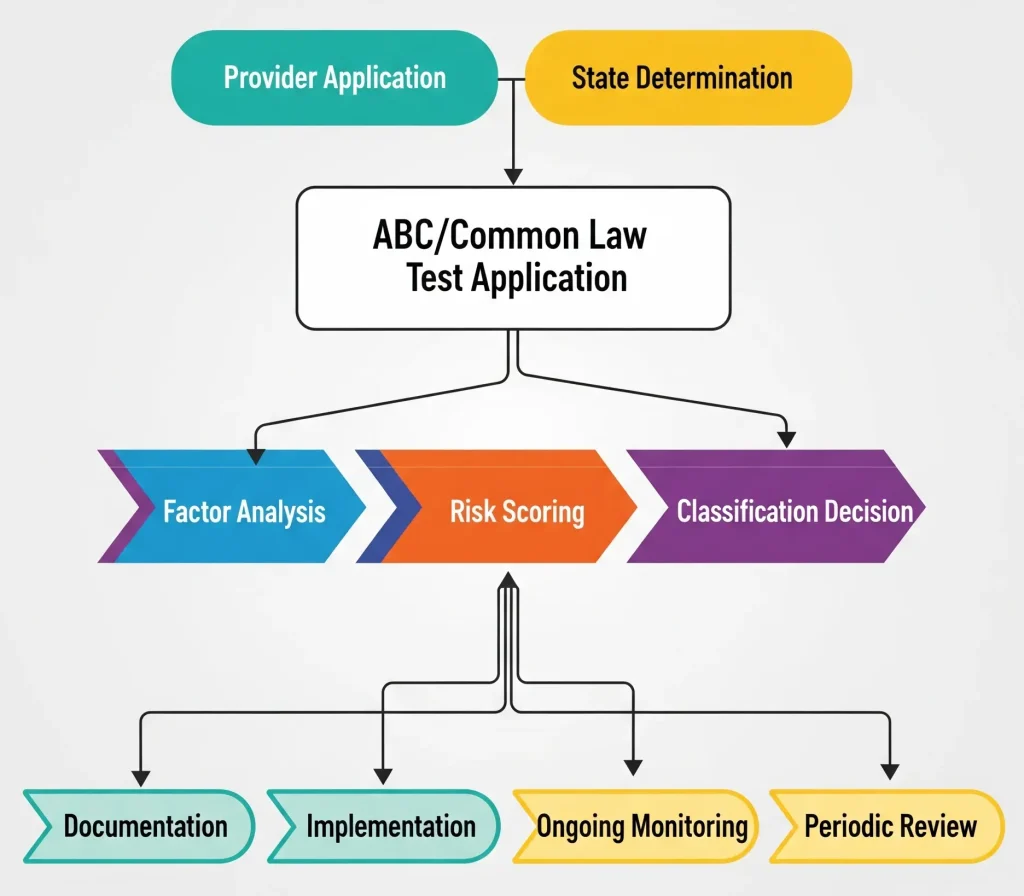
The Classification Spectrum Framework
States fall along a spectrum from contractor-friendly to employee-presumptive:
| Classification Category | States | Test Applied | Risk Level | Compliance Cost |
|---|---|---|---|---|
| Employee-Presumptive | CA, MA, NJ, IL | ABC Test | High | +25-30% operating costs |
| Balanced Approach | NY, PA, WA, CO | Hybrid/Mixed | Moderate | +15-20% operating costs |
| Contractor-Friendly | TX, FL, AZ, GA | Common Law | Lower | +5-10% operating costs |
| Business-Friendly | TN, NV, SD, WY | Minimal Test | Lowest | +3-5% operating costs |
State Classification Comparison:
| State | Classification Test | Key Factors | Penalties for Misclassification | Safe Harbor Provisions |
|---|---|---|---|---|
| California | ABC Test (AB5) | 3 strict prongs | $5,000-25,000 per violation | Limited exemptions |
| Massachusetts | ABC Test | Similar to CA | $750-25,000 per violation | None |
| Texas | Common Law | 20-factor test | Back taxes + 20% penalty | Voluntary classification |
| Florida | Right to Control | 7 factors | Back taxes + interest | Safe harbor available |
| New York | Hybrid Test | Multi-factor | $2,500+ per employee | Limited relief |
The State Classification Matrix:
Employee-Presumptive States (High Risk)
├── California (AB5 - ABC Test)
├── Massachusetts (Strict ABC Test)
├── New Jersey (ABC Test)
└── Illinois (Partial ABC)
Balanced States (Moderate Risk)
├── New York (Hybrid Tests)
├── Pennsylvania (Mixed Standards)
├── Washington (Evolving Laws)
└── Colorado (New Protections)
Contractor-Friendly States (Lower Risk)
├── Texas (Right to Control)
├── Florida (Common Law)
├── Arizona (Business-Friendly)
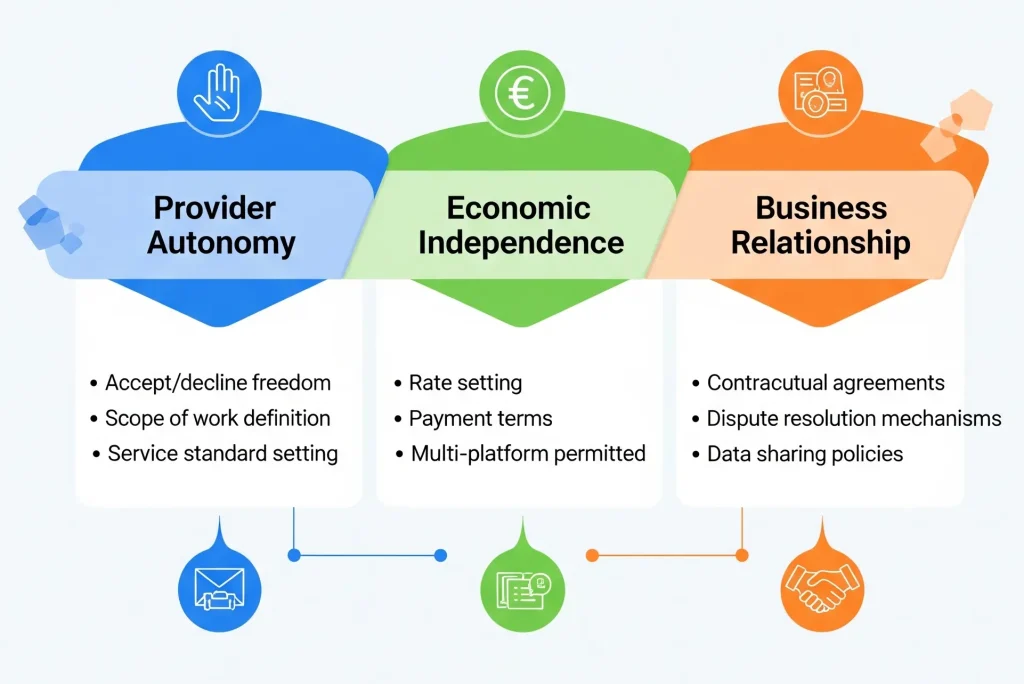
└── Georgia (Traditional Tests)The ABC Test Survival Guide
Understanding and navigating the strictest standard:
The Three-Pronged Framework:
Prong A: Freedom from Control
| Platform CAN: | Platform CANNOT |
|---|---|
| ✓ Set quality standards | ✗ Dictate work methods |
| ✓ Handle customer complaints | ✗ Require specific hours |
| ✓ Establish safety requirements | ✗ Mandate training programs |
| ✓ Facilitate payments | ✗ Supervise work directly |
Prong B: Outside Usual Business
| Safe Services | Risky Services |
|---|---|
| ✓ Specialized trades | ✗ Core platform functions |
| ✓ Professional services | ✗ Customer service |
| ✓ Creative work | ✗ Quality control |
| ✓ Consulting | ✗ Platform operations |
Prong C: Independent Business
Evidence of Independence:
✓ Business license/entity
✓ Multiple platform work
✓ Own tools/equipment
✓ Business insurance
✓ Marketing presence
✓ Negotiated rates
The Platform Protection Protocol™
Build classification defense through strategic platform design:
Level 1: Structural Safeguards
Platform Architecture Decisions
Level 2: Operational Boundaries
The “Hands-Off” Framework:
- Quality Through Ratings not supervision
- Standards Through Agreements not training
- Safety Through Requirements not control
- Success Through Tools not management
Level 3: Documentation Defense
Create an audit-ready classification file:
- Provider Agreements emphasizing independence
- Platform Policies respecting autonomy
- Operational Records showing flexibility
- Provider Communications demonstrating choice
- Economic Data proving independence
Risk Mitigation Strategies
The Classification Risk Calculator:
Risk Score = Base Risk (State Law)
           + Control Factors (Platform Design)
           + Economic Factors (Provider Economics)
           - Mitigation Measures (Safeguards)

Score Interpretation:
0-30: Low Risk - Proceed with confidence
31-60: Moderate - Implement safeguards
61-80: High - Consider restructuring
81-100: Critical - Seek alternatives
Alternative Classification Models:
- Franchise Model: Providers as micro-franchisees
- Agency Model: Platform as booking agent
- Lead Generation: Pure marketplace approach
- Hybrid Structure: Different models by service
The Compliance Evolution Strategy
Stay ahead of changing laws:
Quarterly Review Protocol:
- Monitor Legislation: Track bills in all operating states
- Assess Impact: Model changes on operations
- Adjust Proactively: Implement before required
- Document Changes: Maintain compliance history
The Future-Proof Framework:
Build flexibility for tomorrow’s regulations:
- Modular Platform Design: Easy classification switches
- Multi-Model Capability: Different approaches by state
- Provider Choice Architecture: Optional employment paths
- Regulatory Relationship Building: Engage with lawmakers
Proper provider management systems help maintain classification while ensuring quality.
Chapter 5: Insurance & Liability Requirements
Insurance transforms from expense to investment when you understand its strategic value. Beyond mere compliance, the right insurance architecture becomes your platform’s shield against existential threats while enabling aggressive growth. This chapter reveals the Insurance Optimization Framework™ that minimizes costs while maximizing protection.
State-Specific Insurance Mandates for Service Platforms
Insurance in the US service marketplace requires sophisticated risk management across multiple dimensions. Let’s construct your comprehensive protection strategy.
Insurance Coverage Lifecycle:
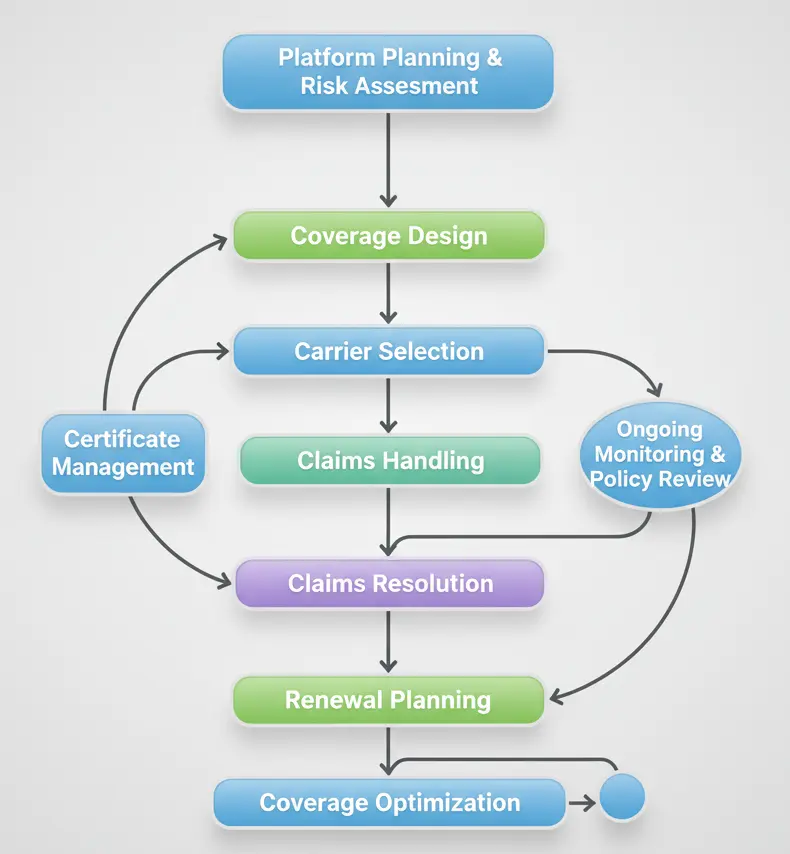
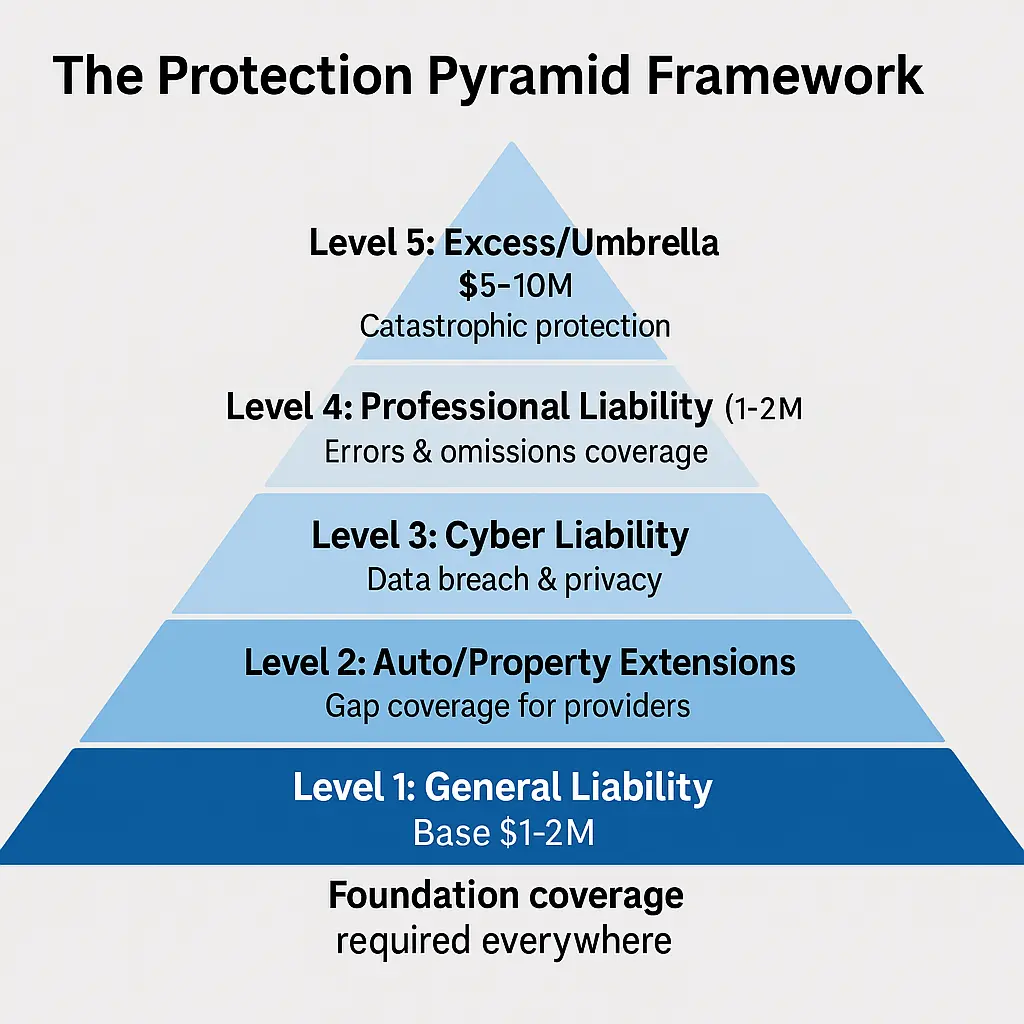
The Insurance Architecture Blueprint
Build your coverage in strategic layers:
The Protection Pyramid Framework:
State-Specific Mandate Matrix
Navigate varying requirements strategically:
| State | GL Minimum | Professional Liability | Bond Required | Annual Premium Est. |
|---|---|---|---|---|
| California | $1M/$2M aggregate | Required for some | $12,500-25,000 | $8,000-15,000 |
| New York | $1M/$2M aggregate | Often required | $10,000-50,000 | $10,000-20,000 |
| Texas | $300K/$600K | Optional | Rarely | $3,000-6,000 |
| Florida | $300K/$600K | Recommended | Sometimes | $4,000-8,000 |
| Illinois | $500K/$1M | Sometimes | Varies | $5,000-10,000 |
Insurance Requirements by Service Type:
| Service Category | General Liability | Professional Liability | Auto/Commercial | Workers Comp | Typical Annual Cost |
|---|---|---|---|---|---|
| Construction/Trades | $1M minimum | Sometimes | If vehicles used | Usually required | $15,000-30,000 |
| Professional Services | $500K minimum | Always required | Rarely | Optional | $5,000-12,000 |
| Home Services | $300K-1M | Recommended | Sometimes | Varies by state | $6,000-15,000 |
| Delivery/Transport | $1M minimum | Not required | Always required | Usually required | $12,000-25,000 |
| Personal Services | $300K minimum | Sometimes | Rarely | Rarely | $3,000-8,000 |
High-Requirement States:
California Comprehensive:
Minimum Requirements:
- General Liability: $1M per occurrence
- Aggregate: $2M annual
- Products/Completed Ops: Included
- Additional Insured: Required
- Home Improvement Bond: $12,500
New York Enhanced:
NYC Additional Layers:
- Higher limits for construction: $2M
- Mandatory excess for high-risk: $5M
- License bonds per trade: $10-25K
- Special event coverage: Required
Texas Balanced:
Strategic Approach:
- Lower minimums: $300K acceptable
- Optional excess encouraged
- Focus on auto coverage gaps
- Workers comp alternatives available
The National Association of Insurance Commissioners frameworks guide platform coverage decisions.
The Gap Coverage Innovation Strategy
Turn insurance gaps into competitive advantages:
The Coverage Gap Solution Framework:
Provider Personal Policy Gaps:
├── Personal Auto → Commercial Use Excluded
├── Homeowners → Business Activities Excluded
├── Health Insurance → Work Injuries Limited
└── Solution: Platform Gap Coverage
Platform Supplemental Coverage:
├── Period 1: App On → $50K liability
├── Period 2: Job Accepted → $100K liability
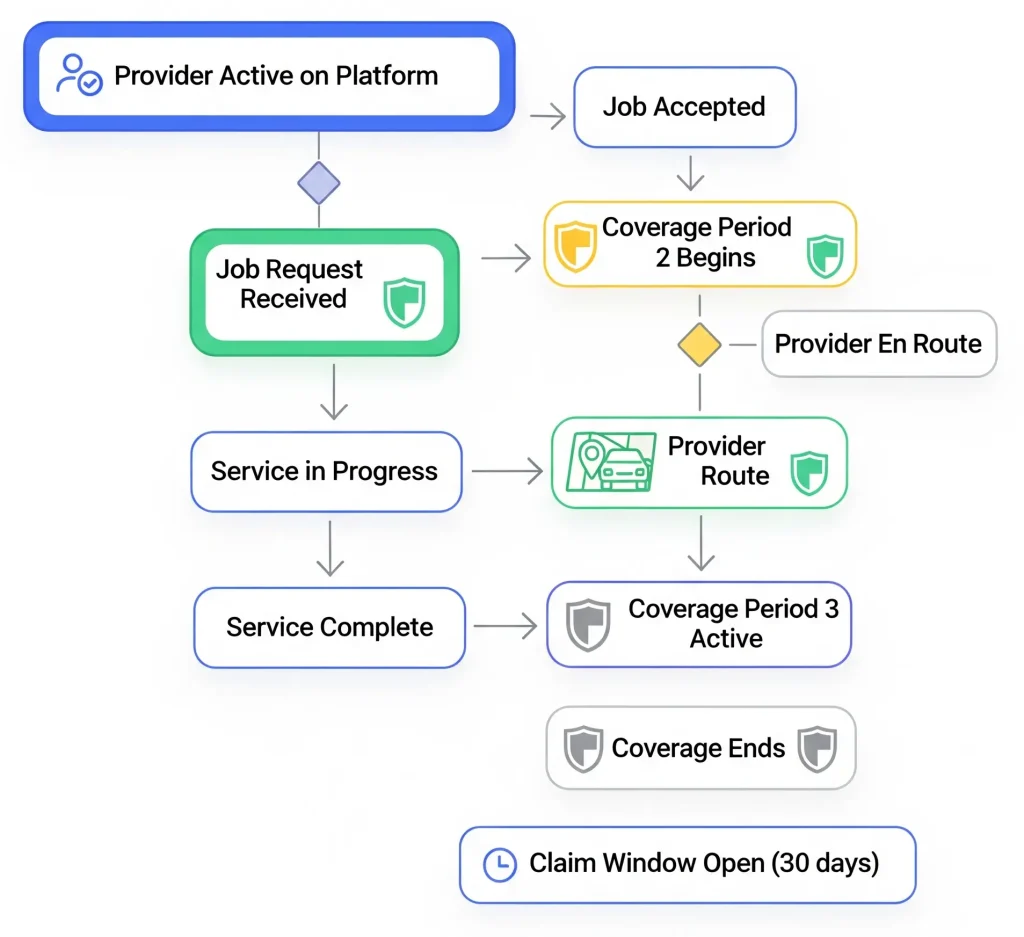
├── Period 3: Service Active → $1M liability
└── Result: Seamless ProtectionGap Coverage Implementation Flow:
Implementation Roadmap:
- Month 1: Audit provider coverage gaps
- Month 2: Design supplemental structure
- Month 3: Negotiate master policies
- Month 4: Integrate verification systems
- Month 5: Launch with competitive advantage
Workers’ Compensation Strategic Planning
Navigate the comp complexity with intelligence:
The Workers’ Comp Decision Tree:
IF State = "Mandatory Coverage States" THEN
   IF Classification = "Employee" THEN
      → Traditional Workers' Comp Required
   ELSE IF Classification = "Contractor" THEN
      → Evaluate Occupational Accident Insurance
      → Consider Voluntary Coverage Options
   END IF
ELSE IF State = "Optional Coverage States" THEN
   → Competitive Advantage Through Voluntary Coverage
   → Market as Provider Benefit
END IF
State-by-State Strategy:
Mandatory States (California, New York):
- Partner with PEO for employment
- Offer occupational accident for contractors
- Build cost into platform economics
Optional States (Texas, Florida):
- Voluntary coverage attracts providers
- Marketing differentiator
- Lower cost than mandatory states
Risk Management Excellence
Transform compliance into competitive moat:
The Platform Protection Protocol:
- Automated Certificate Management
Daily Operations:• COI collection at onboarding• Expiration monitoring• Auto-renewal reminders• Additional insured processing
- Claims Prevention System
Proactive Measures:• Safety training modules• Incident reporting apps• Pattern recognition AI• Provider coaching programs
- Rapid Response Framework
When Incidents Occur:• 24-hour hotline activation• Legal counsel engagement• PR crisis management• Provider support services
Insurance Cost Optimization:
Reduce premiums through strategic design:
- Experience Modification: Better safety = lower rates
- Deductible Strategy: Higher retention = lower premiums
- Carrier Competition: Annual marketplace bids
- Risk Pooling: Industry associations benefits
Chapter 6: Payment Processing Compliance
Payment processing determines whether your platform scales smoothly or stumbles over financial regulations. The maze of money transmitter licenses, PCI compliance, and AML requirements can drain millions in unexpected costs. This chapter delivers the Financial Compliance Acceleration Framework™ that streamlines payments while ensuring bulletproof compliance.
Financial Regulations for US Service Economy Platforms
Payment processing in the American on-demand service marketplace demands sophisticated financial infrastructure. Let’s architect your compliant payment ecosystem using proven frameworks.
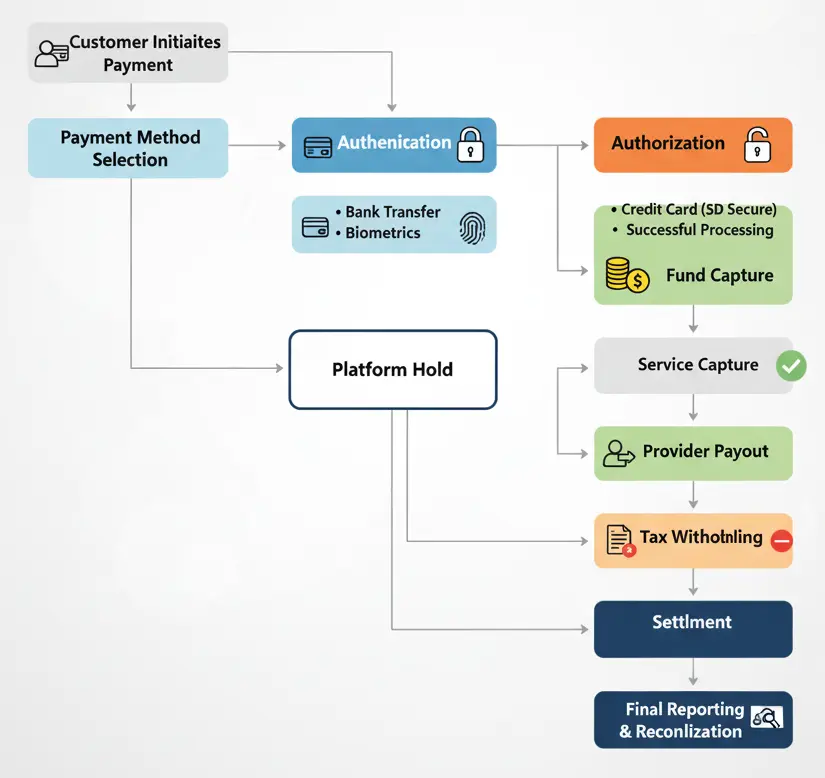
End-to-End Payment Flow:
The Money Transmitter License Matrix
Understanding when you need MTL and when you don’t:
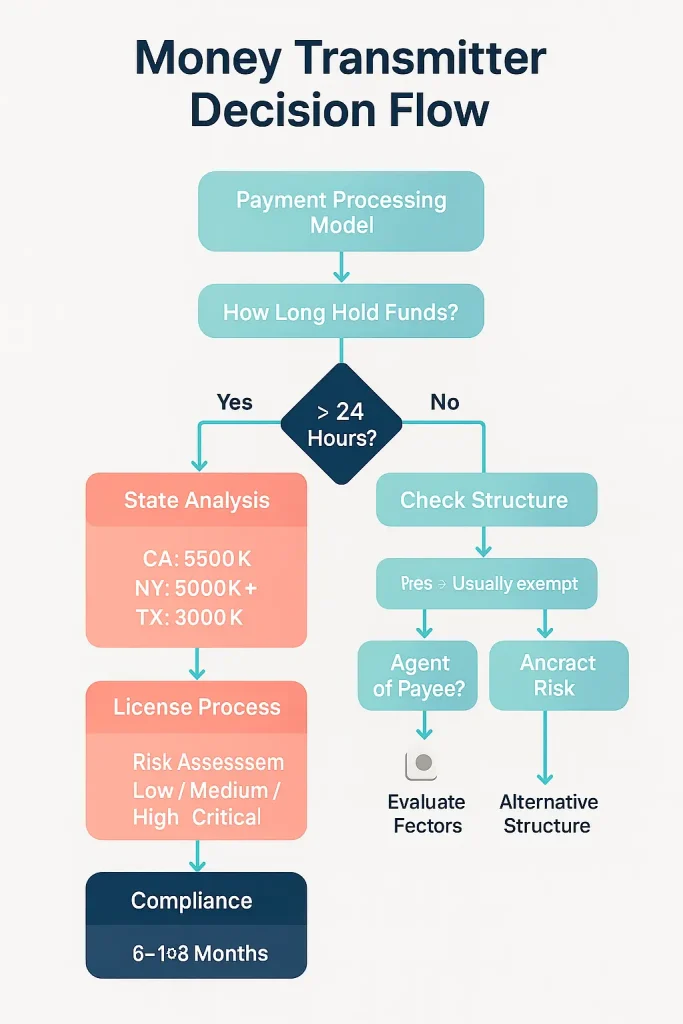
The License Trigger Analysis:
Money Transmitter Triggers:
├── Holding Funds > 24 hours → License Required
├── Provider Payment Delays → License Required
├── Stored Value/Wallets → License Required
└── Currency Conversion → License Required

Exemption Opportunities:
├── Payment Facilitator Model → Often Exempt
├── Agent of Payee Structure → Usually Exempt
├── Instant Pass-through → Generally Exempt
└── Partner Bank Model → Typically Exempt
State-by-State License Requirements:
| State | Bond Requirement | Net Worth | Timeline | Annual Cost | Difficulty Level |
|---|---|---|---|---|---|
| High-Barrier States | |||||
| California | $500,000+ | $500,000 | 6-12 months | $50,000+ | Very High |
| New York | $500,000 | $250,000 | 12-18 months | $75,000+ | Very High |
| Connecticut | $300,000 | $250,000 | 6-9 months | $40,000+ | High |
| Moderate States | |||||
| Texas | $300,000 | $100,000 | 3-6 months | $25,000+ | Moderate |
| Florida | $250,000 | $100,000 | 3-4 months | $20,000+ | Moderate |
| Illinois | $200,000 | $100,000 | 4-6 months | $30,000+ | Moderate |
| Low-Barrier States | |||||
| Arizona | $100,000 | $25,000 | 2-3 months | $10,000+ | Low |
| Nevada | $50,000 | $25,000 | 1-2 months | $8,000+ | Low |
| Delaware | None (PayFac) | N/A | N/A | $5,000+ | Very Low |
Strategic Alternatives:
- Partner with licensed processor
- Structure as payment facilitator
- Use instant settlement model
- Implement segregated accounts
PCI DSS Excellence Framework
Build security that scales:
The PCI Compliance Architecture:
Level 1: Infrastructure Security
├── Network Segmentation
├── Firewall Configuration
├── Encryption Everything
└── Access Control Systems

Level 2: Data Protection
├── Tokenization Strategy
├── Vault Implementation
├── Scope Reduction
└── Key Management

Level 3: Operational Security
├── Vulnerability Scanning
├── Penetration Testing
├── Security Training
└── Incident Response

Level 4: Compliance Validation
├── Self-Assessment Questionnaire
├── External Scanning
├── Audit Preparation
└── Certification Maintenance
PCI Compliance Journey:

Implementation Timeline:
- Week 1-2: Scope assessment and gap analysis
- Week 3-6: Infrastructure implementation
- Week 7-8: Testing and validation
- Week 9-10: Certification process
- Ongoing: Quarterly reviews
State Privacy Law Navigation
Beyond PCI, state privacy laws add layers:
The Privacy Compliance Stack:
Federal Layer (Base):
└── GLBA, FCRA, TCPA

State Layer (Additional):
├── California: CCPA/CPRA
├── Virginia: CDPA
├── Colorado: CPA
├── Connecticut: CTDPA
└── Utah: UCPA

Requirements Matrix:
├── Privacy Notices: All states
├── Opt-out Rights: 5+ states
├── Data Portability: 3+ states
├── Deletion Rights: 5+ states
└── Do Not Sell: California+
Unified Compliance Strategy:
- Build to highest standard (California)
- Create modular privacy controls
- Implement state detection logic
- Automate compliance workflows
Escheat Law Mastery
Turn dormant funds compliance into operational excellence:
The Escheat Management System:
Tracking Framework:
├── Last Activity Date → Per Provider
├── Dormancy Period → By State (1-5 years)
├── Owner State Rules → Address-based
├── Priority Rules → Which state gets funds

Operational Calendar:
├── Daily: Activity monitoring
├── Monthly: Dormancy reports
├── Quarterly: Due diligence
├── Annually: State reporting
└── As Needed: Fund remittance
Escheat Process Flow:
Cost Optimization Strategies:
- Automated reminder systems reduce escheat
- Provider engagement prevents dormancy
- Clear terms minimize abandonment
- Regular sweeps reduce liability
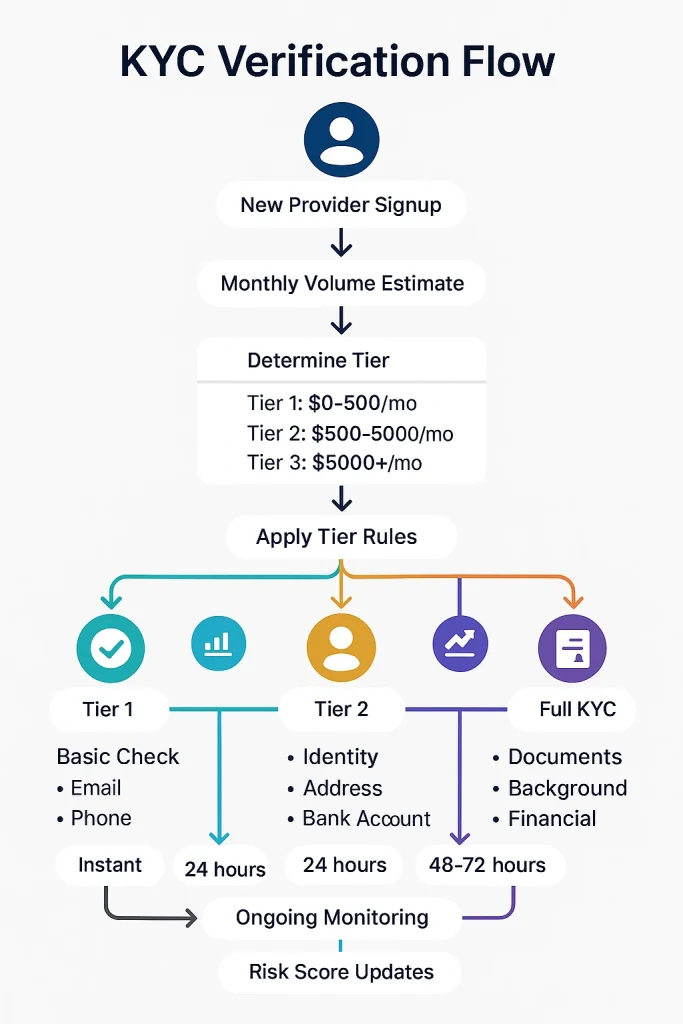
The Progressive KYC Model
Build trust through intelligent compliance:
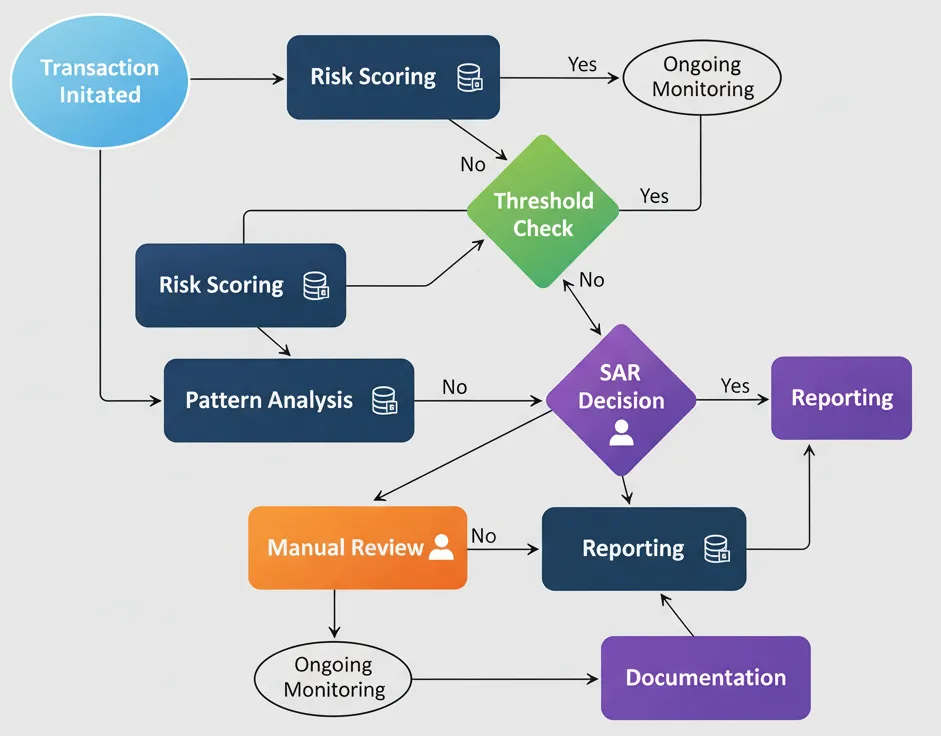
Transaction Monitoring Intelligence:
Risk Scoring Algorithm:
risk_score = base_risk
           + velocity_factor
           + geographic_risk
           + pattern_anomalies
           - trust_indicators

if risk_score > threshold:
    trigger_enhanced_review()
AML Monitoring Flow:
Technology Stack for Compliance:
- KYC/AML: Jumio, Onfido, or Trulioo
- Transaction Monitoring: Chainalysis or ComplyAdvantage
- Payment Processing: Stripe Connect or Adyen MarketPay
- Escheat Management: Sovos or kWallet
- Privacy Compliance: OneTrust or TrustArc
The development of compliant payment infrastructure creates sustainable competitive advantages.
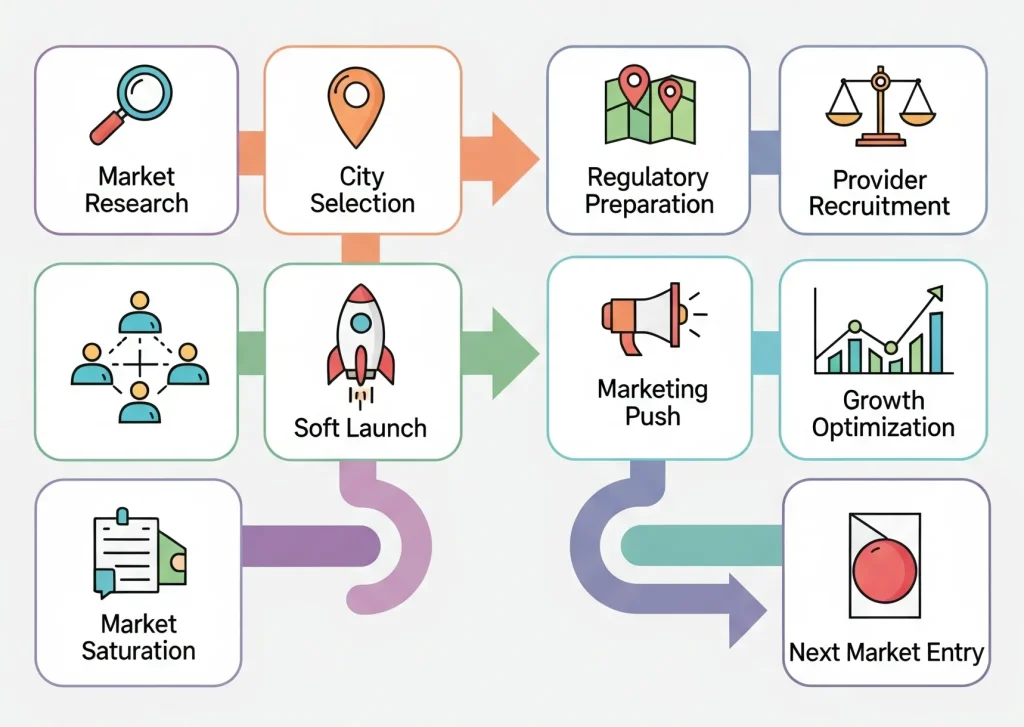
Chapter 7: Market Entry Strategies
Market entry separates platforms that dominate from those that disappear. The difference isn’t funding or features, it’s strategic execution that transforms regulatory compliance into competitive advantage. This chapter presents the Market Domination Playbook™ that accelerates growth while minimizing risk.
State-by-State Expansion Planning for Service Marketplaces
Strategic expansion in the US service marketplace requires military precision and entrepreneurial agility. Let’s build your expansion blueprint using proven methodologies.
Market Expansion Journey:
The Market Entry Decision Framework
Choose your battles wisely:
The Expansion Scoring Matrix:
Top Entry Markets Ranked:
| Rank | City | Market Score | Key Advantages | Entry Cost | Break-Even |
|---|---|---|---|---|---|
| 1 | Austin, TX | 142 | Tech adoption, Low regulation, High growth | $150-250K | 6-9 months |
| 2 | Phoenix, AZ | 128 | Population boom, Favorable laws, Low competition | $125-200K | 7-10 months |
| 3 | Denver, CO | 119 | Educated market, Moderate regulation, Strong economy | $175-275K | 8-12 months |
| 4 | Raleigh-Durham, NC | 108 | Research triangle, Growing population, Business-friendly | $150-225K | 9-12 months |
| 5 | Nashville, TN | 104 | No income tax, Music city growth, Low barriers | $125-175K | 8-11 months |
| 6 | Salt Lake City, UT | 98 | Tech sector, Young demographics, Low regulation | $100-150K | 9-13 months |
| 7 | Las Vegas, NV | 92 | Service demand, No income tax, Tourism base | $150-200K | 10-14 months |
| 8 | Portland, OR | 87 | Progressive market, No sales tax, Tech-savvy | $200-300K | 11-15 months |
Market Score = (Market Size × Growth Rate × Demand Density)
              ÷ (Regulatory Complexity × Competition × Entry Cost)

Score Interpretation:
> 100: Priority 1 - Immediate Entry
50-100: Priority 2 - Near-term Opportunity
25-50: Priority 3 - Future Consideration
< 25: Avoid or Acquire
Phase 1: Single Market Domination
Master one before conquering many:
90-Day Market Launch Flow:

START
  ↓
[Days 1-30: Foundation Phase]
  ├── Legal Setup ────→ [Entity Formation]
  ├── Compliance ─────→ [Licenses & Permits]
  ├── Infrastructure ─→ [Insurance & Banking]
  └── Recruitment ────→ [Initial Providers]
            ↓
[Checkpoint: Legal Complete?]
            ↓
[Days 31-60: Build Phase]
  ├── Onboarding ────→ [100 Providers Target]
  ├── Geography ──────→ [Service Area Maps]
  ├── Economics ──────→ [Pricing Strategy]
  └── Marketing ──────→ [Campaign Launch]
            ↓
[Checkpoint: Supply Ready?]
            ↓
[Days 61-90: Scale Phase]
  ├── Acquisition ───→ [Customer Growth]
  ├── Density ────────→ [Provider Coverage]
  ├── Quality ────────→ [Service Refinement]
  └── Metrics ────────→ [KPI Validation]
            ↓
[Success Metrics Check]
  ├── Density: 1/1000 population?
  ├── CAC: $25-50 achieved?
  ├── Completion: 85%+ rate?
  └── Unit Economics: Positive path?
            ↓
      [Scale or Pivot]
The 90-Day Launch Sprint:
Days 1-30: Foundation
├── Legal entity formation
├── License applications
├── Insurance procurement
├── Payment setup
└── Initial provider recruitment

Days 31-60: Build
├── Provider onboarding (target: 100)
├── Service area mapping
├── Pricing optimization
├── Marketing campaign launch
└── Partnership development

Days 61-90: Scale
├── Customer acquisition push
├── Provider density building
├── Service quality refinement
├── Operational optimization
└── Metrics validation
Success Metrics Framework:
| Metric Category | Target (3 Months) | Target (6 Months) | Target (12 Months) | Red Flag Threshold |
|---|---|---|---|---|
| Provider Metrics | ||||
| Provider Count | 100 | 250 | 500+ | <50 at 3 months |
| Provider Density | 0.5/1000 pop | 0.75/1000 pop | 1/1000 pop | <0.3/1000 at 6mo |
| Provider Retention | 70% | 75% | 80%+ | <60% any time |
| Customer Metrics | ||||
| Active Customers | 500 | 2,000 | 5,000+ | <200 at 3 months |
| CAC | $75-100 | $50-75 | $25-50 | >$150 any time |
| LTV:CAC Ratio | 2:1 | 3:1 | 4:1+ | <1.5:1 at 6mo |
| Operational Metrics | ||||
| Service Completion Rate | 75% | 82% | 85%+ | <70% any time |
| Avg Response Time | <2 hours | <1 hour | <30 min | >4 hours |
| Platform Take Rate | 15-18% | 18-20% | 20-25% | <12% at 6mo |
| Financial Metrics | ||||
| Monthly GMV | $50K | $200K | $500K+ | <$25K at 3mo |
| Unit Economics | -20% | Break-even | +15% | <-30% at 6mo |
| Burn Rate | $40K/mo | $30K/mo | $20K/mo | >$50K/mo |
Phase 2: State-Wide Expansion
Scale within familiar territory:
The Hub-and-Spoke Model:
Hub City (Established)
├── Spoke 1: Suburb A (30-mile radius)
├── Spoke 2: Suburb B (30-mile radius)
├── Spoke 3: Secondary City (50-100 miles)
└── Spoke 4: Tertiary Markets (100+ miles)

Expansion Timeline:
Month 1-3: Suburban spokes
Month 4-6: Secondary city
Month 7-12: Tertiary markets
State Expansion Flow:
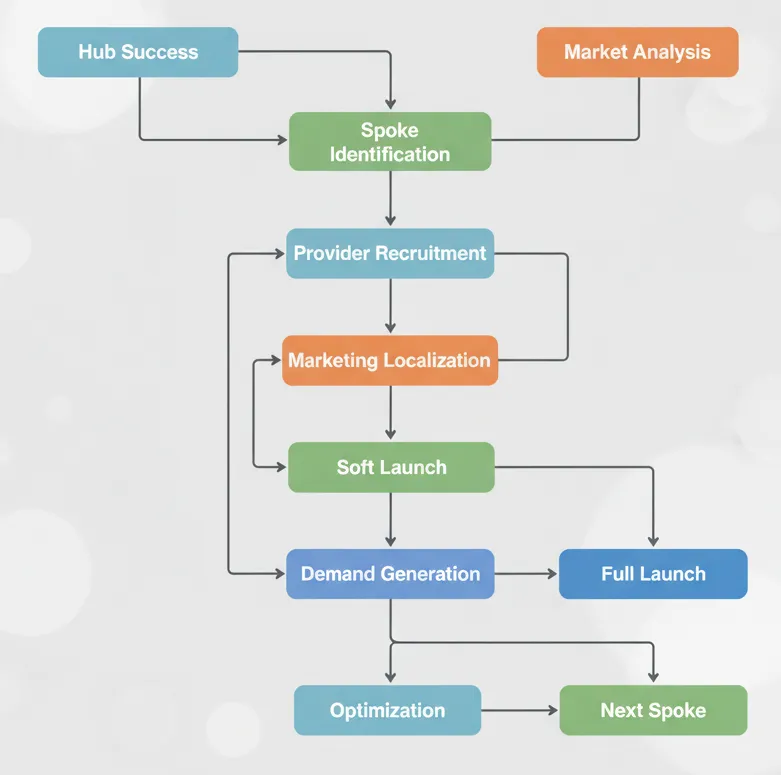
Operational Leverage Strategy:
- Shared marketing campaigns
- Unified provider training
- Centralized support
- State-level partnerships
- Economies of scale
Phase 3: Regional Conquest
Build regional strongholds:
The Regional Domination Framework:
Southwest Strategy:
Phoenix → Tucson → Las Vegas → Albuquerque

Southeast Strategy:
Atlanta → Charlotte → Raleigh → Nashville

Texas Triangle:
Austin → Houston → Dallas → San Antonio

Mountain West:
Denver → Salt Lake City → Boise → Colorado Springs
Regional Advantages:
- Marketing efficiency (regional campaigns)
- Operational synergies (shared logistics)
- Provider mobility (cross-market work)
- Brand recognition (regional presence)
- Partnership leverage (regional deals)
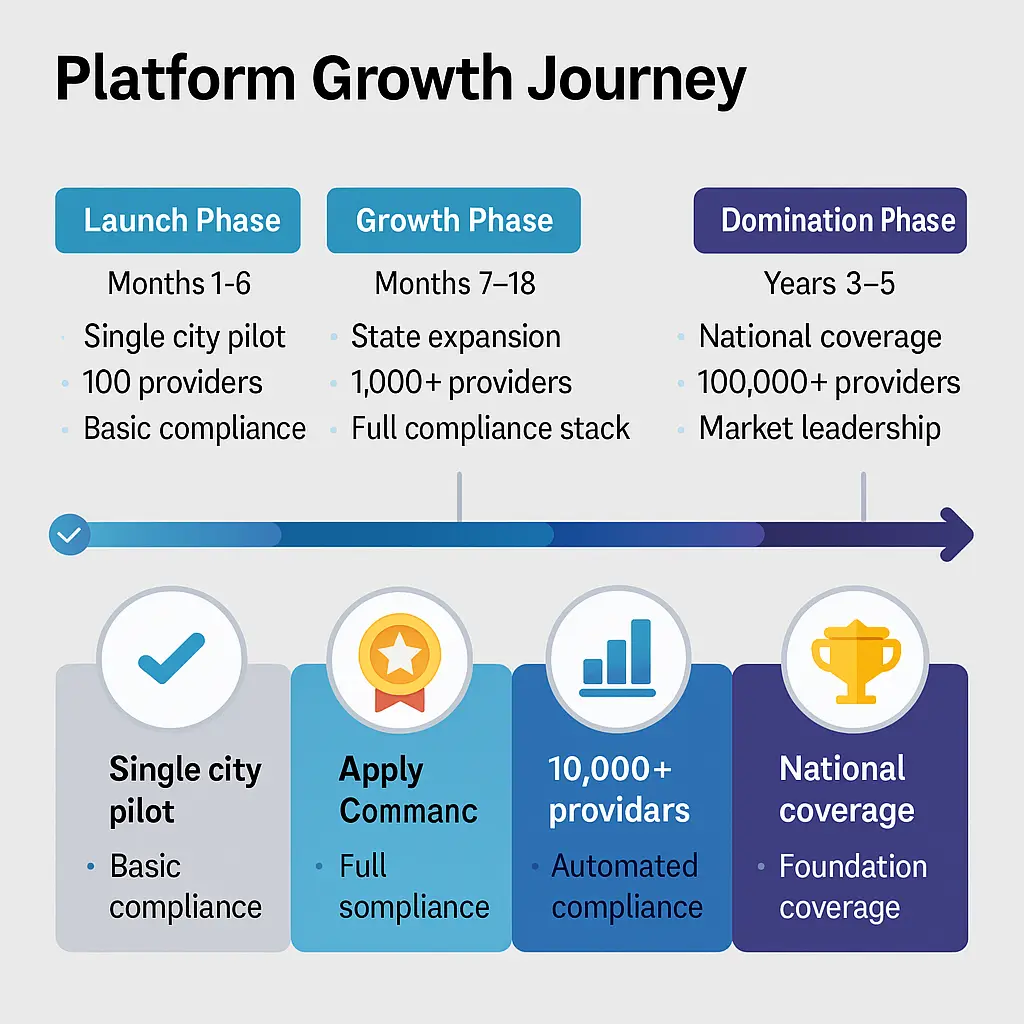
Phase 4: National Presence
Achieve coast-to-coast coverage:
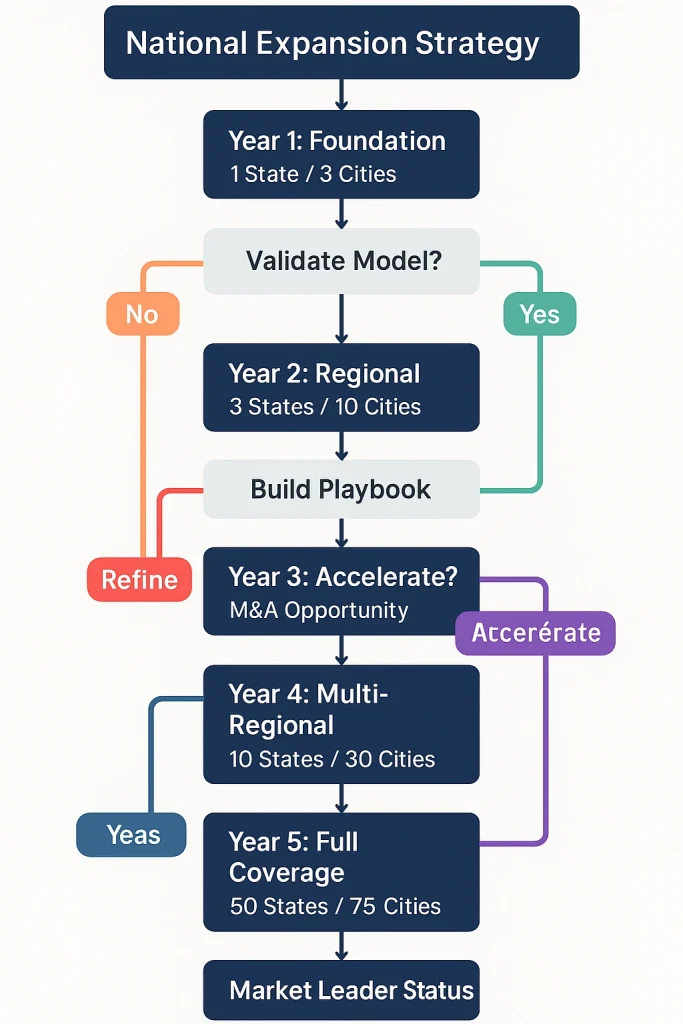
The National Rollout Strategy:
Organic Growth Path:
Year 1: 1 state, 3 cities
Year 2: 3 states, 10 cities
Year 3: 10 states, 30 cities
Year 4: 25 states, 75 cities
Year 5: 50 states, 150+ cities
Accelerated Growth Through M&A:
Acquisition Targets:
├── Local market leaders (geographic expansion)
├── Vertical specialists (service expansion)
├── Technology platforms (capability expansion)
└── Distressed competitors (market consolidation)

Valuation Framework:
Enterprise Value = (Revenue × 3-5x)
                  + (Provider Base × $500-1000)
                  + (Technology Assets)
                  - (Regulatory Liabilities)
Market Entry Tactics Arsenal
Comparison of Market Entry Strategies:
| Strategy | Time to Market | Capital Required | Risk Level | Control | Best For |
|---|---|---|---|---|---|
| Organic Growth | 6-12 months | $100-500K | Low-Moderate | 100% | First-time founders |
| Partnership | 3-6 months | $50-250K | Moderate | Shared | Quick validation |
| Acquisition | 1-3 months | $500K-5M | High | 100% | Funded startups |
| Franchise Model | 4-8 months | $200-800K | Moderate-High | Partial | Rapid scaling |
| Joint Venture | 3-6 months | $100-400K | Moderate | 50-50 | Market expertise |
Detailed Strategy Comparison:
| Factor | Organic | Partnership | Acquisition | Franchise |
|---|---|---|---|---|
| Advantages | ||||
| Brand Control | Complete | Partial | Complete | Strong |
| Culture Preservation | 100% | 75% | Variable | 80% |
| Learning Curve | Gradual | Accelerated | Instant | Moderate |
| Flexibility | Maximum | High | Low initially | Moderate |
| Disadvantages | ||||
| Speed to Market | Slowest | Moderate | Fastest | Moderate |
| Resource Intensity | High | Shared | Very High | Moderate |
| Execution Risk | High | Moderate | Integration risk | Quality control |
| Competitive Response | Time to react | Shared defense | Eliminated | Distributed |
| Financial Model | ||||
| Initial Investment | $100-500K | $50-250K | $500K-5M | $200-800K |
| Ongoing Costs | Variable | Shared | Fixed + Variable | Franchise fees |
| Revenue Share | 100% | 50-70% | 100% | 80-90% |
| Break-even Timeline | 9-18 months | 6-12 months | 12-24 months | 8-15 months |
The key is building scalable platform architecture supporting multi-state operations while maintaining local relevance.
Conclusion
The American on-demand service marketplace represents one of the most dynamic yet challenging environments for platform development globally. Success requires more than innovative technology—it demands deep regulatory understanding and strategic execution.
Key Success Factors
Regulatory Mastery: Turn compliance into competitive advantage by building robust systems that handle state variations seamlessly.
Strategic Market Selection: Choose expansion markets based on:
- Market size and growth potential
- Regulatory complexity
- Competition intensity
- Operational synergies
Flexible Platform Architecture: Build systems that adapt to:
- Varying state requirements
- Different service categories
- Evolving regulations
- Scale demands
Future Outlook
The American home services platform sector continues evolving:
- Regulatory harmonization may emerge through interstate compacts
- New worker classifications could bridge contractor-employee gap
- Technology advances will simplify compliance management
- Consumer expectations will drive platform innovation
Taking Action
Platform operators should:
- Start with thorough planning before market entry
- Invest in compliance infrastructure early
- Build flexible systems for regulatory adaptation
- Focus on sustainable growth over rapid expansion
- Partner with experts for complex requirements
Success in the US service economy requires patience, resources, and commitment to compliance. Those who master the regulatory landscape while delivering exceptional user experiences will capture significant market share in this growing industry.
Ready to Build Your Service Marketplace Platform?
Capture your share of the $57.6 billion on-demand services industry.
Don’t wait for tomorrow’s competition.
Frequently Asked Questions (FAQ)
What are the most critical regulations I need to address before launching a service marketplace in the US?
The four pillars of compliance you must address are worker classification laws, state licensing requirements, tax obligations, and insurance mandates. Worker classification determines whether your providers are contractors or employees, with states like California requiring strict ABC test compliance that can increase operational costs by 25-30%.
State licensing varies dramatically California requires contractor licenses for work over $500 while Texas sets the threshold at $50,000. For taxes, you’ll need to monitor economic nexus (typically triggered at $100,000 in sales or 200 transactions per state) and implement marketplace facilitator tax collection in 43 states. Insurance requirements include general liability coverage ranging from $300,000 to $2 million depending on your state and services offered.
Start by achieving compliance in your launch state, then build flexible systems that can adapt as you expand. Budget approximately $50,000 to $200,000 for initial compliance setup depending on your scope.
Which state should I choose for my initial launch, and why?
The best launch state depends on your resources and risk tolerance. Texas (specifically Austin) offers the optimal combination for most startups: no state income tax, business-friendly regulations, tech-savvy population, and reasonable compliance costs around $150,000-250,000 for market entry. The state’s common law approach to worker classification is more flexible than California’s ABC test, reducing operational complexity.
Florida presents another strong option with its diverse demographics, year-round service demand, and moderate regulations. If you’re well-funded and want immediate credibility, California offers the largest market at $12.3 billion but requires $500,000 to $1 million for proper market entry due to strict regulations.
For bootstrapped startups, consider Phoenix, Arizona or Denver, Colorado—both offer growing markets with reasonable regulatory requirements and entry costs under $200,000. Avoid starting in New York unless you have substantial funding, as the combination of state and city regulations creates significant compliance burden.
Do I need a money transmitter license, and how can I avoid this requirement?
You need a money transmitter license if you hold customer funds for more than 24 hours, offer wallet features, or pool funds in platform accounts. These licenses cost $500,000+ in bonds for states like California and New York, with application processes taking 6-18 months and annual compliance costs exceeding $50,000 per state.
You can avoid this requirement by structuring your platform as a payment facilitator through partners like Stripe Connect or Adyen MarketPay, using instant pass-through payment processing where funds flow directly from customers to providers, or operating as an agent of the payee.
Most successful platforms avoid MTL requirements by partnering with licensed payment processors, which handles the regulatory burden while charging approximately 2.9% + $0.30 per transaction. This approach saves hundreds of thousands in licensing costs and allows you to launch within weeks rather than months.
How do I handle worker classification to avoid lawsuits and penalties?
Proper worker classification requires building platform architecture that preserves provider independence. In ABC test states (California, Massachusetts, New Jersey), ensure providers maintain freedom from control by allowing them to accept or decline jobs, set their own schedules, work for competitors, and control their service methods. Never mandate training, uniforms, or specific working hours.
Document everything that demonstrates provider independence: business licenses, insurance certificates, multi-platform work evidence, and provider-controlled pricing within broad bands. Implement a provider agreement emphasizing their independent business status and avoid language suggesting employment relationships.
In common law states (Texas, Florida, Arizona), you have more flexibility but should still maintain clear contractor relationships. Consider offering providers a choice between contractor and employee status in progressive states, or explore alternative models like franchising. Misclassification penalties can reach $5,000-25,000 per violation plus back taxes and benefits, making proper structure essential. Budget $50,000-100,000 upfront for legal structure to avoid millions in potential penalties.
What’s the realistic budget and timeline for launching and scaling nationwide?
A realistic path to national presence requires $2-5 million in total investment over 3-5 years, though you can start with much less. Single-city MVP launch costs $100,000-250,000 with 6-9 month break-even. State-wide coverage requires $250,000-500,000 with profitability in 12-18 months. Multi-state expansion needs $500,000-1.5 million to establish regional presence.
Your burn rate will typically run $20,000-30,000 monthly for single city operations, scaling to $200,000+ monthly for national operations. Expect compliance costs to consume 20-30% of revenue initially, declining to 7-10% at scale. Key cost drivers include legal and compliance setup (20-25% of budget), technology development (30-35%), provider acquisition at $50-200 per provider, and customer acquisition at $25-100 per customer.
Timeline expectations: achieve product-market fit in your first city within 6 months, expand state-wide by month 12, enter your second state by month 18, establish regional presence (3-5 states) by year 2, and reach national coverage (25+ states) by year 3-5. Acquisitions can accelerate this timeline by 40-50%, while partnerships enable 30% faster expansion.
What insurance coverage do I absolutely need, and what’s optional?
Essential coverage from day one includes general liability insurance ($1 million per occurrence minimum, costs $5,000-10,000 annually) and cyber liability insurance ($1 million minimum, costs $3,000-5,000 annually) given the sensitive data you’ll handle. These protect against basic operational risks and data breaches that could otherwise destroy your business.
Once you’re processing payments, add professional liability/E&O coverage ($1 million, costs $4,000-8,000 annually) to protect against service-related claims. When revenue exceeds $1 million, secure excess/umbrella coverage ($5 million, costs $2,000-5,000 annually) for catastrophic protection.
Optional but recommended coverage includes employment practices liability if you have employees, commercial auto if providing transportation services, and D&O insurance once you take outside investment. Workers’ compensation becomes mandatory if you classify any providers as employees. Total insurance costs typically run $15,000-30,000 annually for early-stage platforms, scaling to $50,000-100,000 for established operations. Join industry associations for group rates that can reduce premiums by 10-15%.
How do I efficiently handle different licensing requirements across states?
Implement a three-tier verification system to manage varying state requirements efficiently. First, integrate with automated verification APIs like Middesk or Certn for real-time license validation in states with digital databases. This handles 60-70% of verifications instantly. Second, create a document upload system with OCR scanning for states requiring manual verification, maintaining a 24-48 hour review turnaround.
Build a provider dashboard showing license status, expiration dates, and renewal requirements. Set up automated alerts at 60, 30, and 7 days before expiration. Create state-specific onboarding flows that only request required documents for each provider’s location and service type. For example, California requires extensive documentation for contractors, while Texas has minimal requirements for the same services.
Maintain a compliance matrix tracking requirements by state and service category, updating quarterly as regulations change. Consider partnering with compliance-as-a-service providers who maintain these databases and handle verification workflows. This approach reduces your compliance team needs from 5-10 people to 1-2 people while ensuring accuracy. Budget $10,000-20,000 annually for verification services and $30,000-60,000 for initial system setup.
Can I use the same platform model across all states, or do I need different approaches?
While you can maintain core platform functionality across states, you’ll need state-specific adaptations for compliance. California’s AB5 might require offering employee options or restructuring as a referral agency, while Texas allows traditional contractor models with minimal modifications. New York City adds municipal regulations requiring additional platform features beyond state requirements.
Build a modular architecture that enables state-specific configurations: different onboarding flows based on licensing requirements, variable tax calculation engines for each jurisdiction, state-specific terms of service and provider agreements, and customizable worker classification models. This flexibility allows you to maintain one platform while meeting diverse requirements.
Some platforms successfully operate different models by state—contractors in Texas, employees in California, and choice models in progressive states. The key is building technology and operations that can handle this complexity without confusing users. Expect to spend an additional $20,000-50,000 per state for major adaptations, though many states can share configurations. Focus on building flexible systems from the start rather than retrofitting later, which costs 3-4 times more.
What are the most expensive mistakes platforms make, and how do I avoid them?
The costliest mistake is ignoring worker classification requirements, leading to penalties of $5,000-25,000 per violation plus back taxes, potentially reaching millions in liability. Avoid this by investing $50,000-100,000 upfront in proper legal structure and documentation.
Second is expanding too quickly without achieving unit economics in your first market. Platforms burn through funding trying to grow nationally before proving their model, leading to collapse when funding dries up. Instead, focus on achieving profitability in one city before expanding, even if it takes 6-12 months longer.
Third is inadequate insurance coverage, where one lawsuit or data breach causes bankruptcy. Platforms try to save $10,000-20,000 on insurance premiums but face millions in uncovered claims. Maintain at least $1 million general liability and cyber coverage from day one.
Fourth is building technology without compliance features, requiring expensive retrofitting later. Include license verification, tax calculation, and audit trails from the start. Finally, attempting to handle money transmission without proper licenses can trigger cease-and-desist orders and criminal prosecution. Partner with licensed payment processors instead of trying to manage funds directly.
How do I know when I’m ready to expand to additional states?
You’re ready for state expansion when you achieve five key metrics in your current market. First, positive unit economics with contribution margin exceeding 20% and CAC payback under 6 months. Second, operational excellence with 85%+ service completion rates and provider retention above 70% annually. Third, scalable systems including automated onboarding, compliance monitoring, and customer support handling 80% of issues without manual intervention.
Fourth, sufficient capital with 18-month runway for new market plus buffer for current operations, typically $200,000-300,000 per new state. Fifth, proven playbook with documented processes for provider recruitment, market launch, and growth optimization that delivered predictable results in your first market.
Warning signs you’re not ready include monthly burn exceeding revenue by more than 50%, provider churn above 10% monthly, manual processes still handling core operations, or regulatory issues unresolved in current market. Premature expansion is the second leading cause of platform failure after worker classification issues. Better to dominate one state profitably than struggle in multiple states, as focused platforms have 3x higher success rates than those attempting rapid geographic expansion.